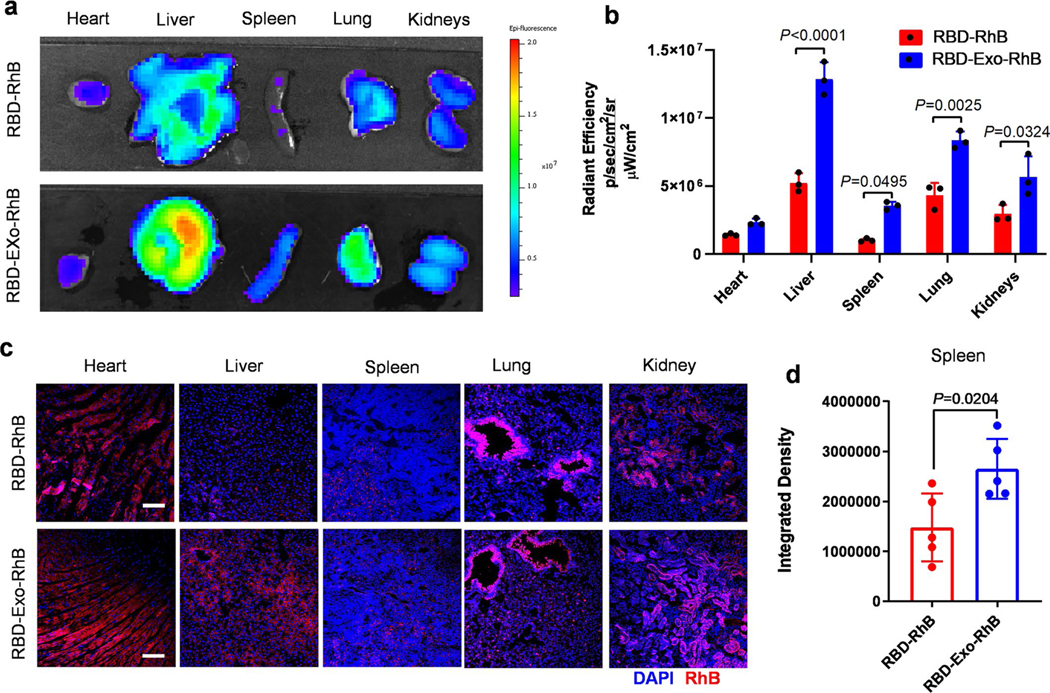
Extended Data Fig. 4 |. Biodistribution of RBD-Exo in mice after inhalation.

a, Ex vivo imaging of major organs of mice 24 hours after RBD-Exo-RhB or RBD-RhB inhalation. b, Quantification of the integrated density of RhB fluorescence in the major organs; n = 3 per group. c, Confocal images showing the biodistribution of RBD-Exo-RhB or RBD-RhB in heart, liver, spleen, lung, and kidney tissues. Scale bar, 50 μm. d, Quantitative results from in spleen tissues. n = 5. Data are mean ± s.d. Statistical analysis was performed by two-tailed, unpaired Student’s t-test. The replicates in b are biological. Analysis in d represents the technical replicates from three independent biological samples.
