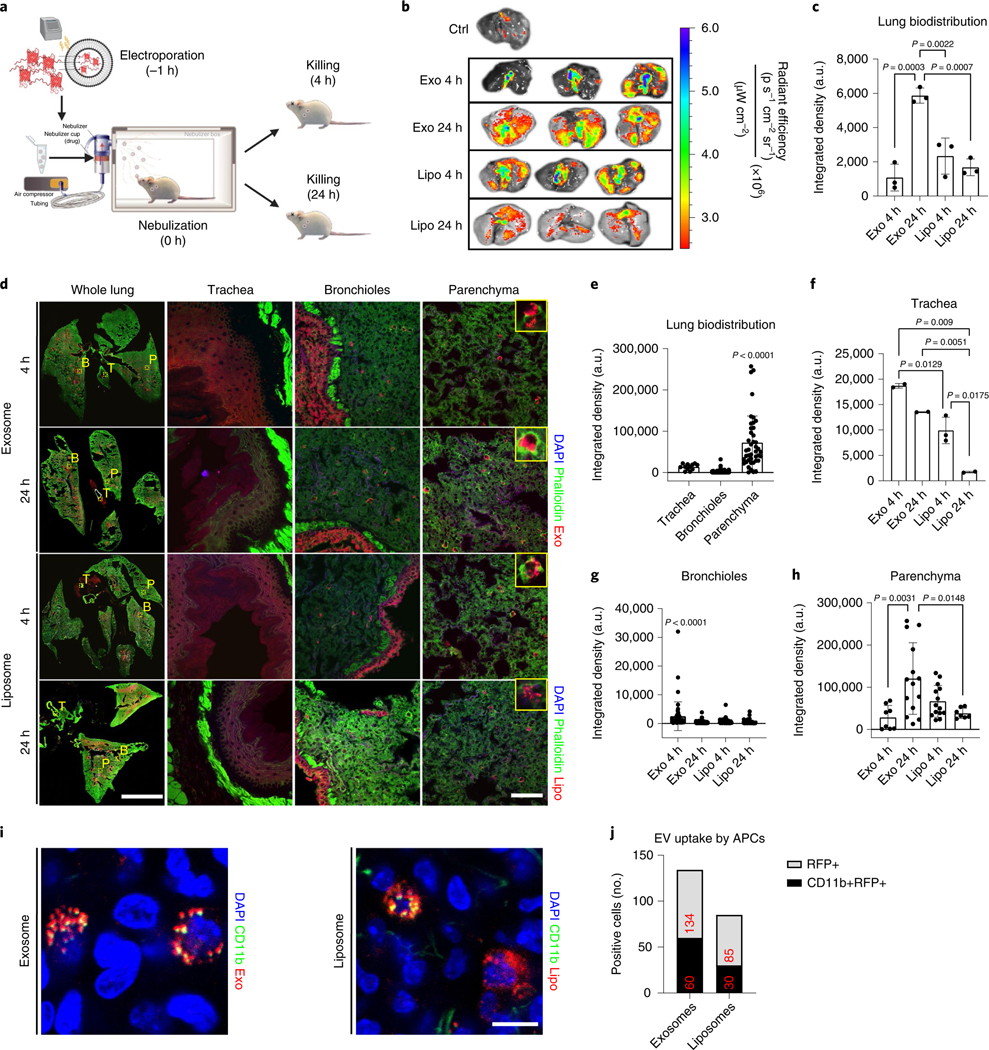
Fig. 2 |. Lung distribution of the RFP-loaded LSC-exosomes.

a, The experimental study schematic of RFP-loaded LSC-exosomes and RFP-loaded liposomes in healthy CD1 mice, n = 3 per group. b, Ex vivo imaging of mouse lungs after RFP-loaded LSC-exosome or RFP-loaded liposome delivery after 4 and 24 h. c, Quantification of the integrated density of RFP fluorescence in ex vivo mouse lungs; each dot represents data from one lung, n = 3 per group. d, Immunostaining of whole lung, tracheal, bronchial and parenchymal sections for DAPI (blue), phalloidin (green) and exosomes (red) or liposomes (red). These images were obtained under ×10 magnification. T, trachea; B, bronchioles; P, parenchyma. Scale bar, 1,000 μm for whole lung, 100 μm for parenchyma. e, Quantification of the integrated density of RFP fluorescence across all groups in tracheal, bronchial and parenchymal tiles from whole lung images; each dot represents data from one image tile, n = 12–276. f–h, Quantification of the integrated density of RFP fluorescence in tracheal (f), bronchial (g) and parenchyma (h) tiles from whole lung images; each dot represents data from one image tile, n = 2–82. i, Immunostaining of parenchymal sections for DAPI (blue), CD11b (green), and exosomes (red) or liposomes (red). Scale bar, 50 μm. j, Quantification of exosome or liposome uptake by CD11b+ APCs in ex vivo mouse lungs; numbers in red indicate total number of positive cells across all representative images, n = 6 images per group. EV, extracellular vesicle. Throughout, data are mean ± s.d. P values were calculated by one-way ANOVA with Bonferroni correction. The replicates in c are biological. Analysis in e–h, and j represents the technical replicates. The schematic in a was created with BioRender.com.
