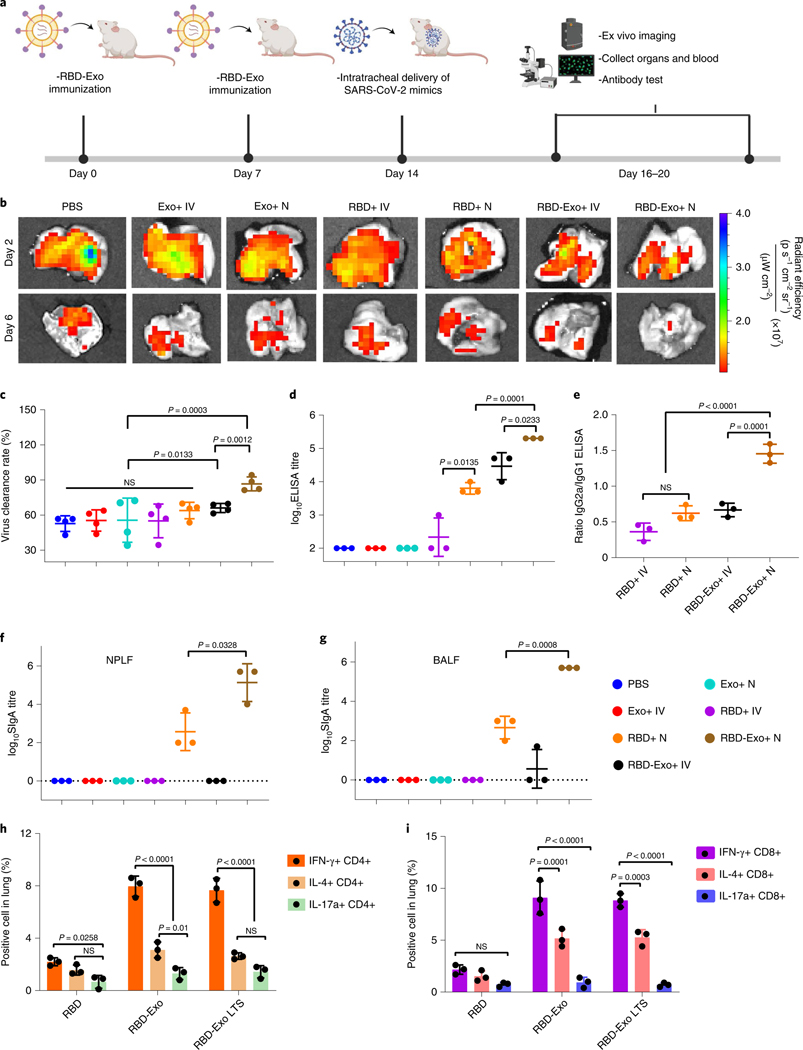
Fig. 4 |. Vaccination with RBD-Exo induces antibody production and enhances the clearance of SARS-CoV-2 mimics in mice.
a, Schematic illustrating animal study design. b, Ex vivo imaging of the lungs of mice after intratracheal delivery of SARS-CoV-2 mimics at different time points. c, Semi-quantitative analysis of SARS-CoV-2 mimics labelled with AF647 from confocal images of lung tissues, n = 4. d, Anti-RBD antibody titre from murine serum detected by ELISA, n = 3. e, Ratio of RBD-specific IgG2a to IgG1 antibody generated, n = 3. f,g, RBD-specific SIgA antibody titres from NPLF (f) and BALF (g) detected by ELISA, n = 3. h,i, IFN-γ+, IL-4+ or IL-17a+ of CD4+ T cells (h) and CD8+ T cells (i) specific to the RBD peptide pool in the lung at week 1 after second vaccination. RBD-Exo LTS, RBD-Exo reconstitution after 3 weeks of storage at room temperature, n = 3. Throughout, data are mean ± s.d., statistical analysis by two-tailed, unpaired Student’s t-test (c–g) or two-way ANOVA with a Tukey post hoc test for multiple comparisons (h,i). All replicates are biological. The schematic in a was created with BioRender.com.

