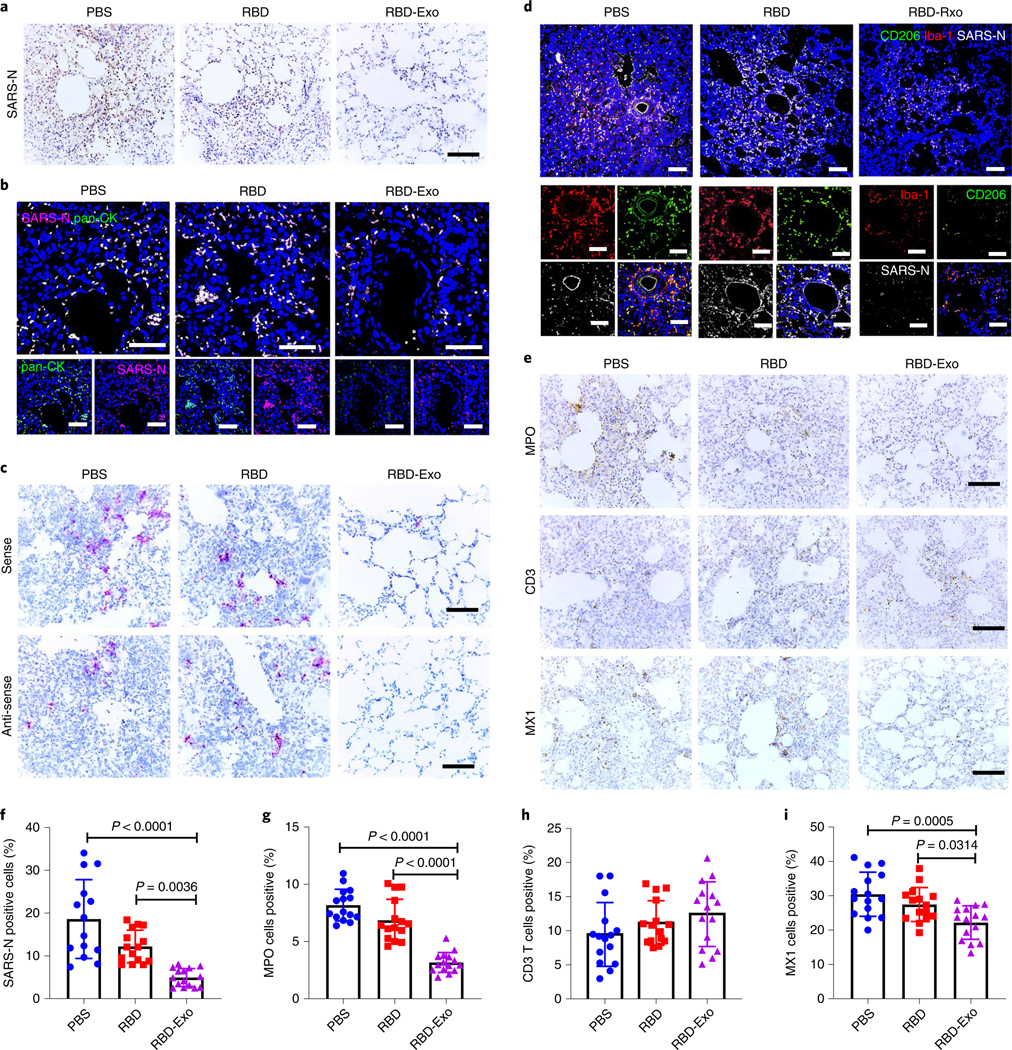
Fig. 7 |. Histopathological changes and RNAscope analysis in Syrian hamsters vaccinated with RBD-Exo.

a, SARS-N IHC staining of lung tissues in hamsters vaccinated with PBS, RBD or RBD-Exo at 7 d post viral challenge. Scale bar, 100 μm. b, Immunofluorescence images of pan-CK (green), SARS-N (magenta) and DAPI (blue) of lung tissues in hamsters to study the distribution of SARS-N. Scale bar, 50 μm. c, RNAscope in situ hybridization detection of vRNA in lung tissues of hamsters at 7 d post challenge. Scale bar, 100 μm. d, Immunofluorescence images of Iba-1 (red), CD206 (green), SARS-N (greyscale) and DAPI (blue) of lung tissues in hamsters at 7 d post challenge. Scale bar, 50 μm. e, IHC staining of MPO, CD3 T lymphocytes and interferon inducible gene MX1 of hamsters at 7 d post challenge. Scale bar, 100 μm. f, Quantitation of SARS-N positive cells of lung tissues in hamsters. Each dot represents data from one image file, n = 15. g–i, Quantitation of positive MPO (g), CD3 (h) and MX1 (i) cell numbers in lung tissues of hamsters. Each dot stands for data from one image file, n = 15. Throughout, data are mean ± s.d., P values calculated by one-way ANOVA with Bonferroni correction. Analysis in f–i represents technical replicates from 5 independent biological samples.
