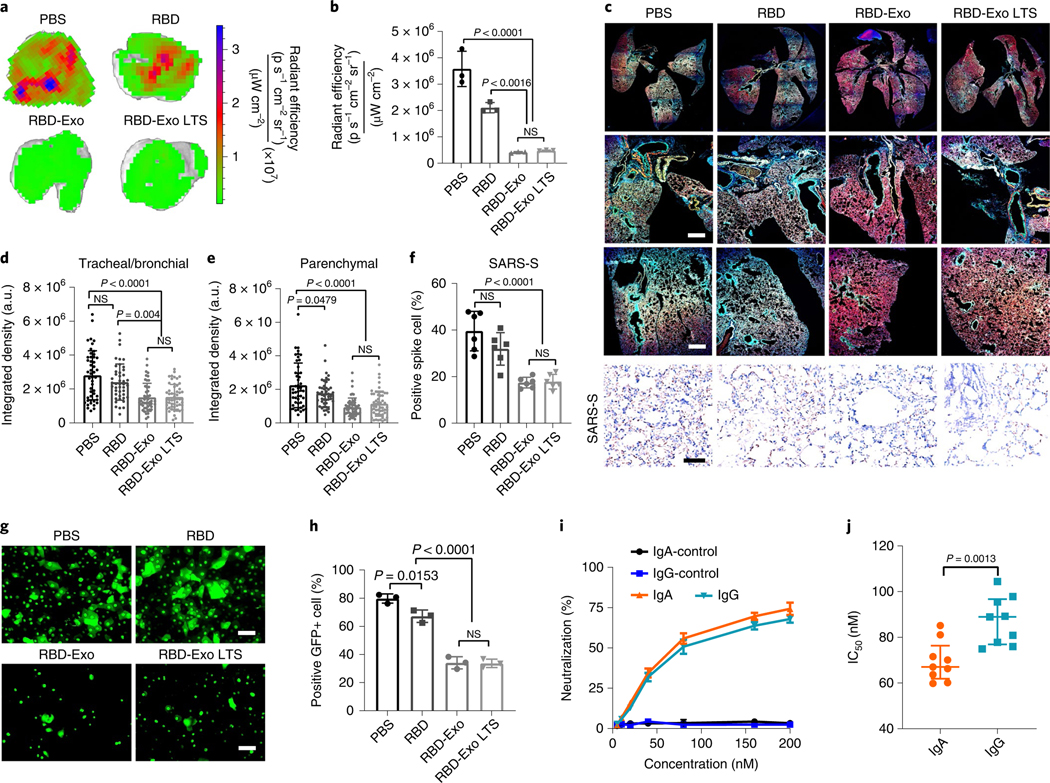
Fig. 8 |. RBD-Exo VLP efficiently neutralizes the SARS-CoV-2 D614g pseudovirus.
a, Ex vivo imaging of lungs of immunized mice after inoculation with SARS-CoV-2 D614G pseudovirus with GFP expression for 24 h. b, Quantification of the integrated density of GFP fluorescence in ex vivo mouse lungs; each dot represents data from one lung, n = 3 per group. c, Immunostaining imaging of whole lung (top row), trachea/bronchioles (middle row) and parenchyma (bottom row) of mice with different vaccinations for DAPI (blue), phalloidin (red) and SARS-CoV-2 D614G pseudovirus (green), and immunohistochemistry staining of spike protein of SARS-CoV-2 D614G pseudovirus (SARS-S, bottom row) in lung tissue after different vaccinations. Whole lung images were taken under ×10 magnification. Scale bar, 50 μm. d,e Quantification of the integrated density of GFP fluorescence in tracheal/bronchial (d) and parenchymal tiles (e) from whole lung images. Each dot represents data from one image tile, n = 43–55. f, Quantitation of positive spike protein cell numbers in lung tissues. Each dot stands for data from one image, n = 6. g, SARS-CoV-2 D614G pseudovirus-infected primary bronchial/tracheal epithelial cells with GFP expression, inhibited by IgA antibodies purified from vaccinated mice. Scale bar, 50 μm. h, Flow cytometry plots of SARS-CoV-2 D614G pseudovirus-infected primary small airway epithelial cells, which were inhibited by IgA antibodies purified from vaccinated mice, n = 3 per group. i,j, Purified IgG and IgA pseudovirus neutralization assay (i) and IC50 values (j), n = 3 per group in i; n = 9 per group in j. Data are mean ± s.d., statistical analysis by one-way ANOVA with Bonferroni correction (b, d–f, h) or two-tailed, unpaired Student’s t-test (j). The replicates in b, h and i are biological. Analysis in d–f and j represents technical replicates from 3 independent biological samples.

