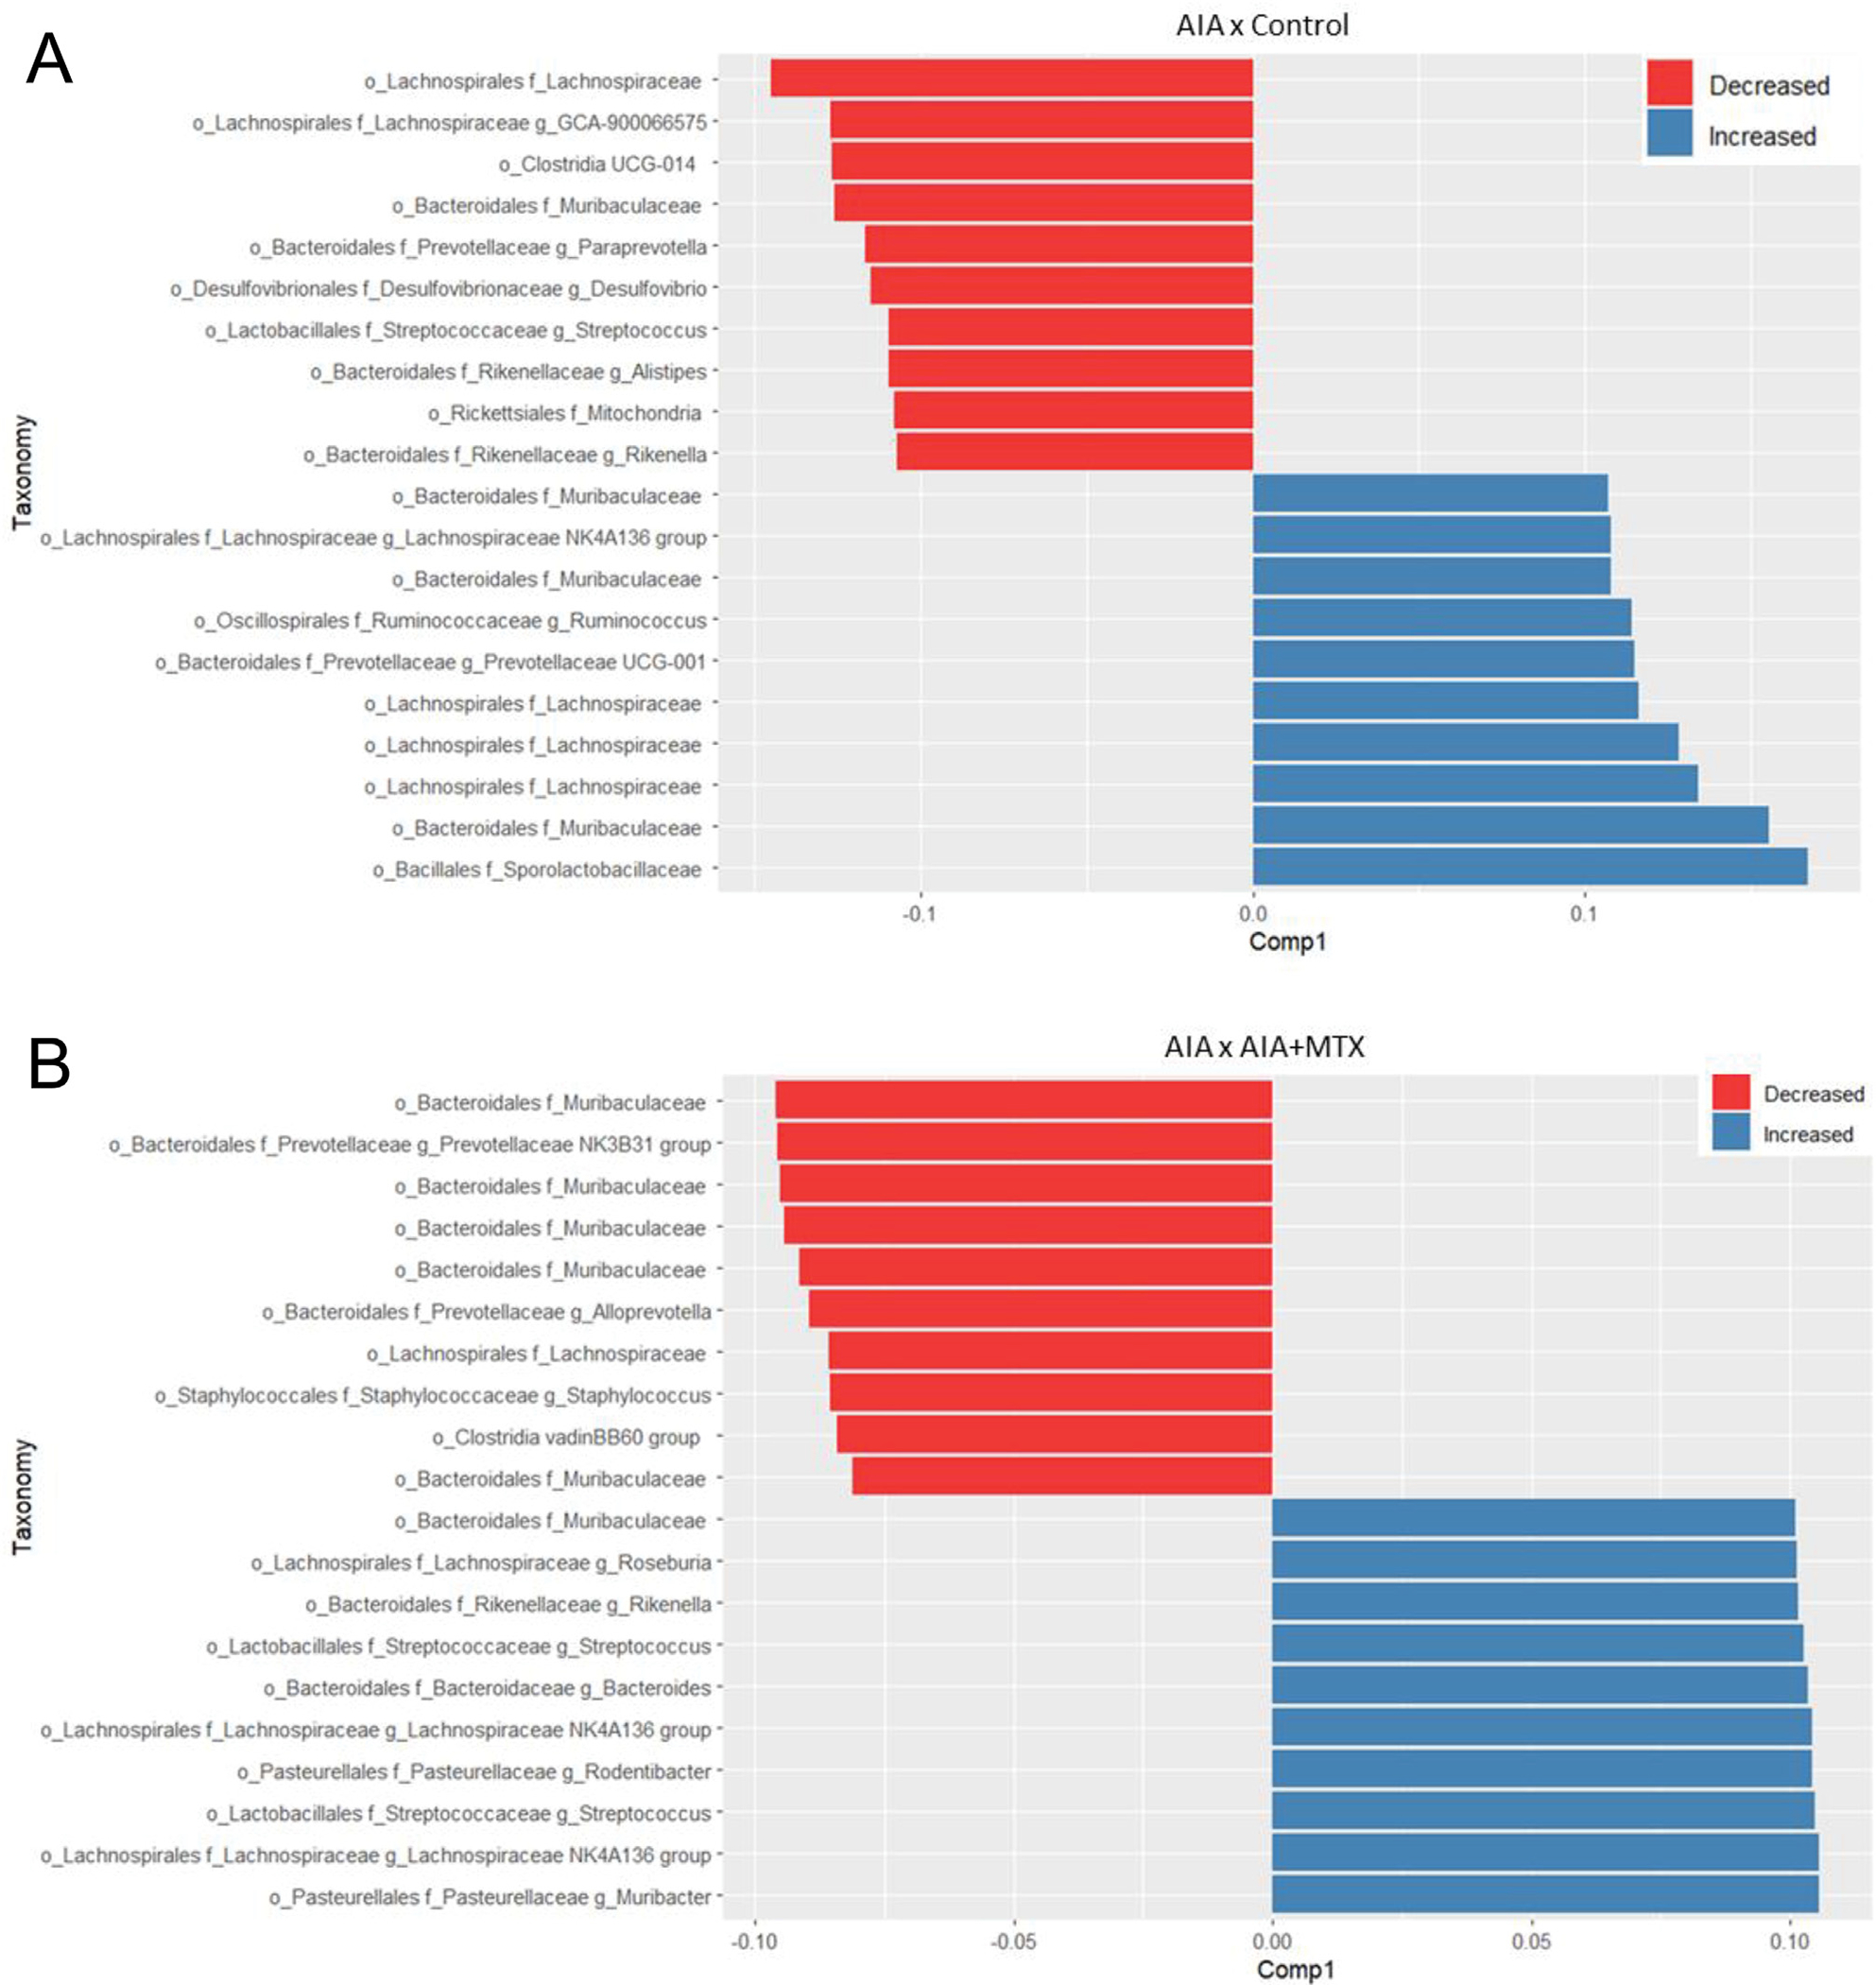
Fig. 6.

(A) Graph depicting oral operational taxonomic units (OTU) with differences in relative abundance in the AIA group compared to control animals based on partial least squares-discriminant analysis (PLSDA). (B) Graph depicting oral OTU with differences in relative abundance in the AIA + MTX group compared to AIA animals based on PLSDA results.
