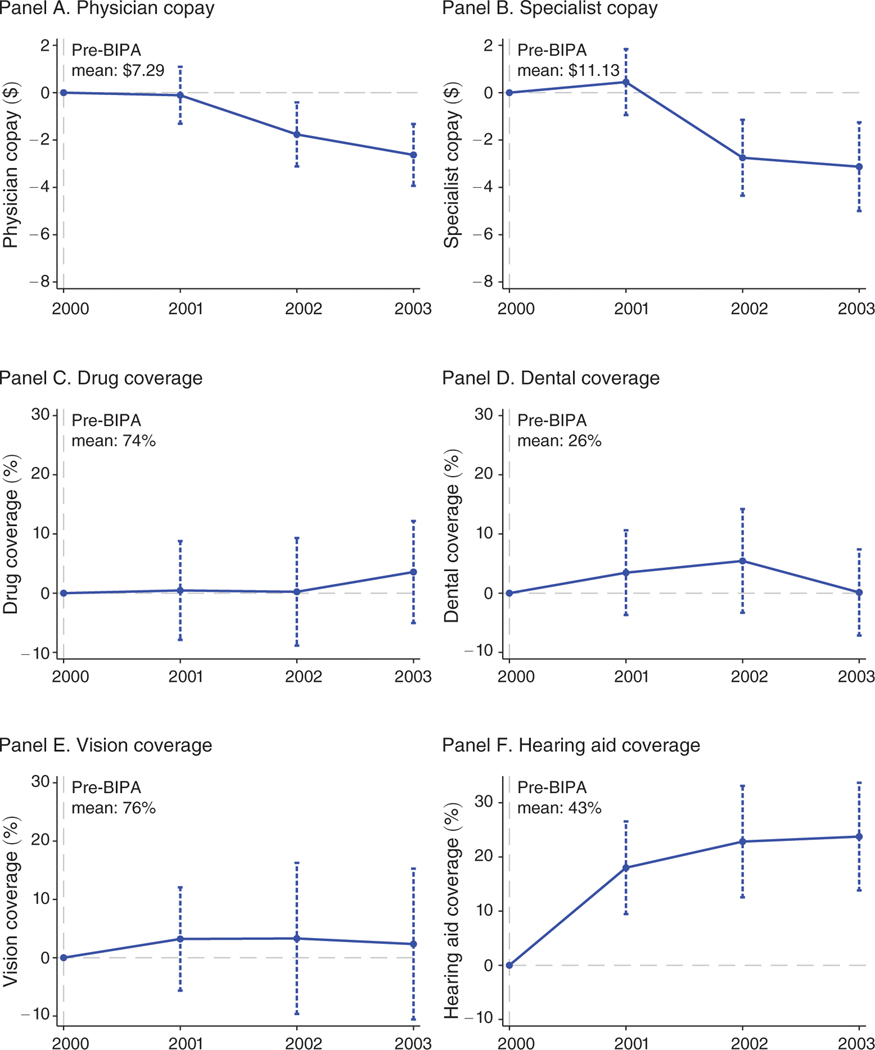
Figure 5. Benefits Generosity: Impact of $50 Increase in Monthly Payments.
Notes: Figure shows scaled coefficients on distance-to-floor × year interactions from difference-in-differences regressions. The first-stage results displayed in Table 3 indicate that a $1 change in distance-to-floor translates into a $1 change in the monthly payments, so we can interpret the coefficients as the effect of an increase in monthly payments on a dollar-for-dollar basis. The dependent variables are physician copays in dollars (panel A), specialist copays in dollars (panel B), and indicators for coverage of outpatient prescription drugs (panel C), dental (panel D), corrective lenses (panel E), and hearing aids (panel F). The unit of observation is the county × year, and observations are weighted by the number of beneficiaries in the county. The sample is the unbalanced panel of county-years with at least one MA plan over years 2000 to 2003. This sample includes 2,250 of 12,572 possible county-years and 62 percent of all Medicare beneficiaries. Controls are identical to those in Figure 3. In panels A and B, the vertical axes measure the effect on copays in dollars of a $50 difference in monthly payments. In panels C through F, the vertical axes measure the effect on the probability that a plan offers each benefit, again for a $50 difference in monthly payments. The capped vertical bars show 95 percent confidence intervals calculated using standard errors clustered at the county level. Year 2000, which is the year prior to BIPA implementation, is the omitted category. The horizontal dashed line is plotted at 0.

