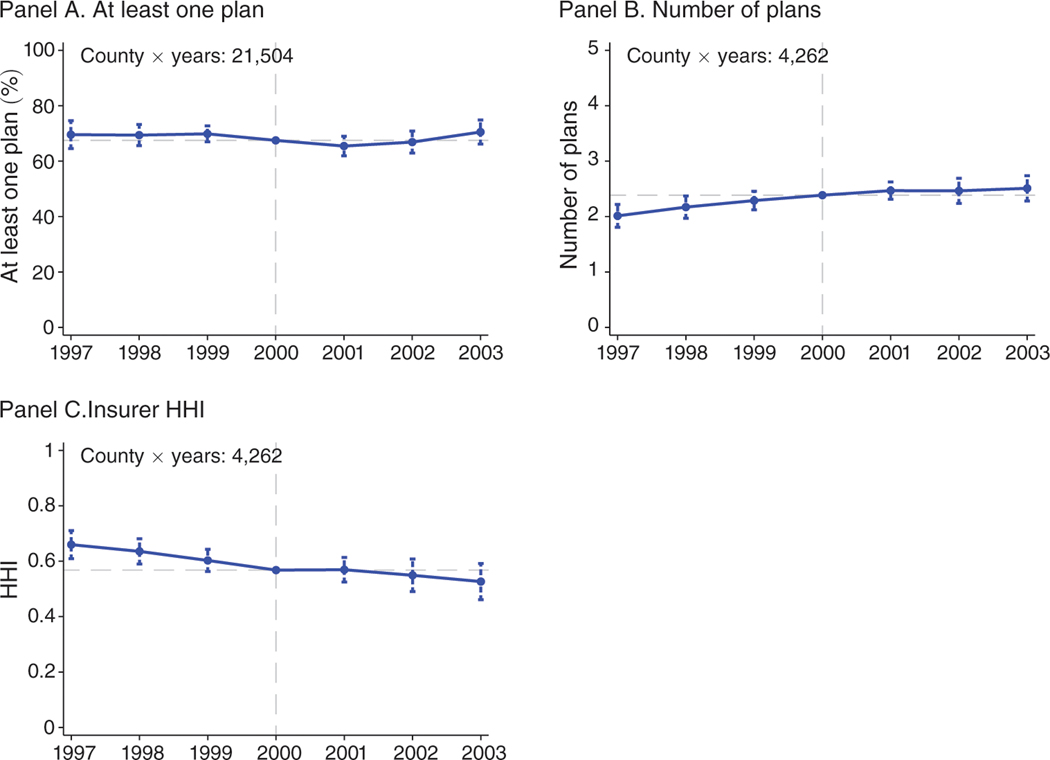
Figure 7. Plan Availability: Impact of $50 Increase in Monthly Payments.
Notes: Figure shows scaled coefficients on distance-to-floor × year interactions from difference-in-differences regressions. The first-stage results displayed in Table 3 indicate that a $1 change in distance-to-floor translates into a $1 change in the monthly payments, so we can interpret the coefficients as the effect of an increase in monthly payments on a dollar-for-dollar basis. Coefficients are scaled to reflect the impact of a $50 increase in monthly payments. The dependent variable in panel A is an indicator for at least one plan. The dependent variable in panel B is the number of plans conditional on at least one plan. The dependent variable in panel C is a Herfindahl-Hirschman Index (HHI) with a scale of 0 to 1. The unit of observation is the county × year, and observations are weighted by the number of beneficiaries in the county. The sample in panel A is the balanced panel of county-years with non-missing information on base rates and Medicare beneficiaries during 1997 to 2003. This sample includes 21,504 of 22,001 county-years and more than 99.9 percent of all Medicare beneficiaries. The sample in panels B and C is the unbalanced panel of county-years with at least one MA plan over years 1997 to 2003. This sample includes 4,262 of 22,001 possible county-years and 64 percent of all Medicare beneficiary-years. Controls are identical to those in Figure 3. The capped vertical bars show 95 percent confidence intervals calculated using standard errors clustered at the county level. The horizontal dashed lines are plotted at the sample means, which are added to the coefficients.

