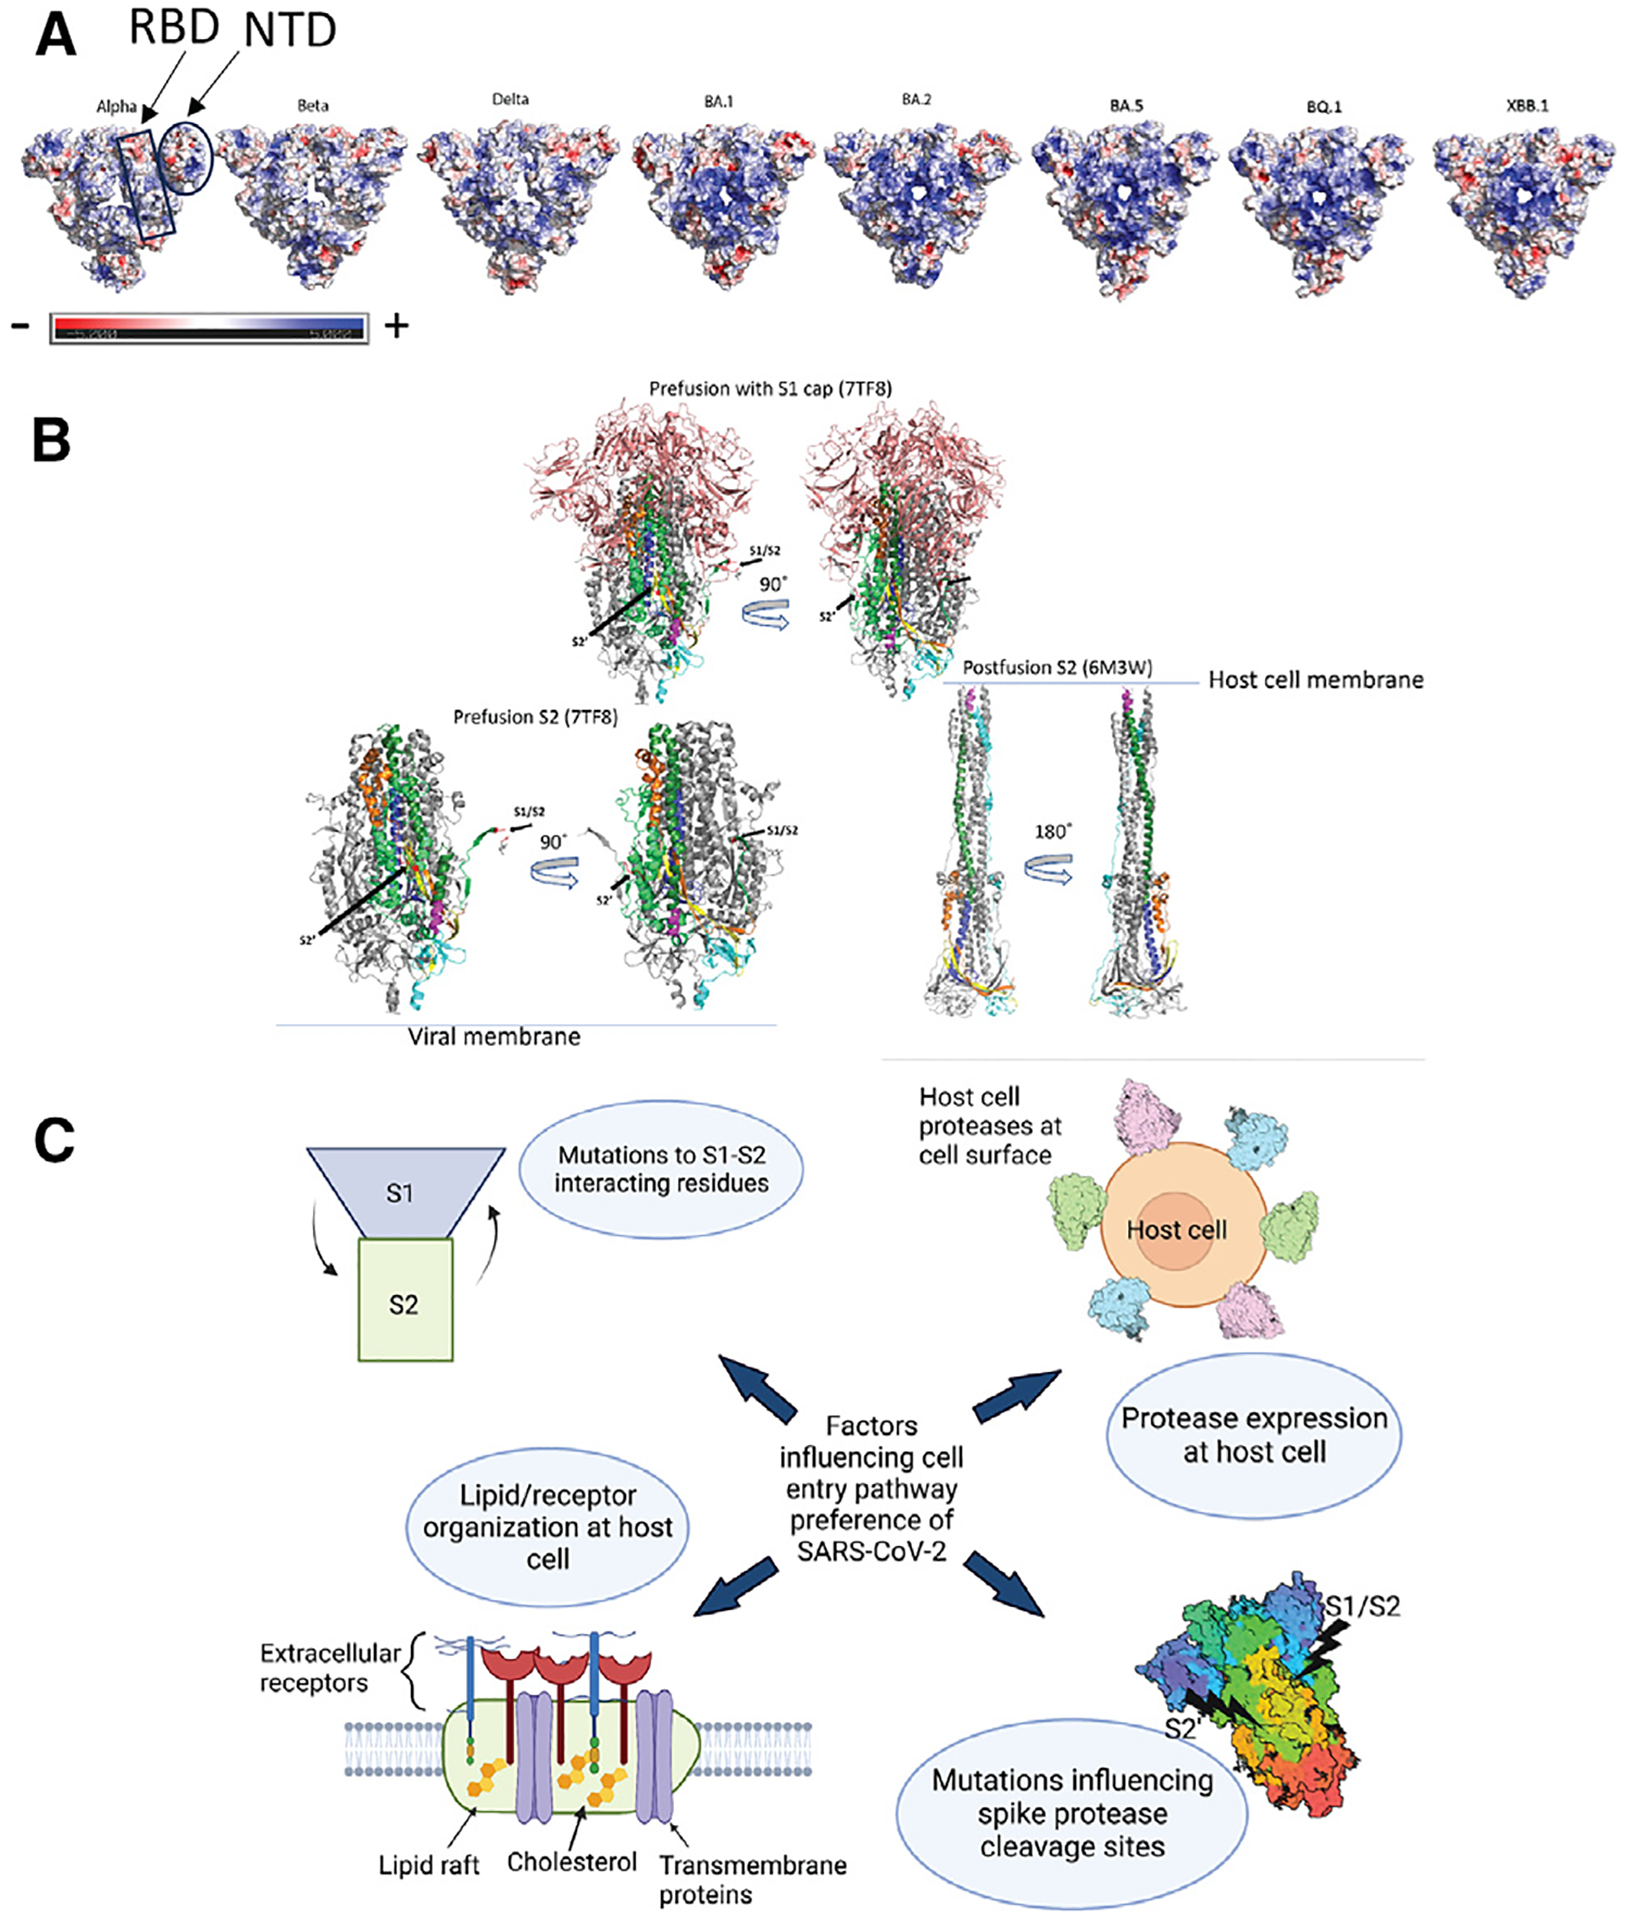
Figure 4. Electrostatics, pre- to postfusion S conformation changes, and other factors influencing cell entry.

(A) Top surface views of S protein ectodomain colored by electrostatic potential. PDB IDs: 7TOU (Delta), 7TL1 (BA.1), 7UB6 (BA.2), 8IOS (XBB.1). Mutations for BA.5 and BQ.1 are modeled on the BA.2 structure. Beta and Gamma have one RBD in the up position in these structures. The rest of the structures have 3 RBDs in the down position.
(B) Top: pre-fusion Omicron BA.1 (PDB: 7TF8) showing the S1 cap (salmon) covering the S2 subunit. Bottom left: pre-fusion S2 shown without the S1 cap. Bottom right: postfusion S2. Coloring for (A)–(C): gray, monomers 2 and 3 (coloring is only shown on 1 monomer); salmon: S1 cap; forest green: HR2; yellow: CD; TV blue, CH; lime green: regions in S2 of pre-fusion structure but not shown in postfusion because the residues are not resolved; magenta: postfusion structure: residues 901–909, pre-fusion structure: 919–927; cyan: C-terminal. Postfusion: 1069–1178. Pre-fusion: 1087–1147. Red: S1/S2 and S2′ cleavage sites as labeled on pre-fusion structure. Orange: region after S1/S2.
(C) Diagram showing possible factors involved in SARS-CoV-2 cell entry pathway selection.
