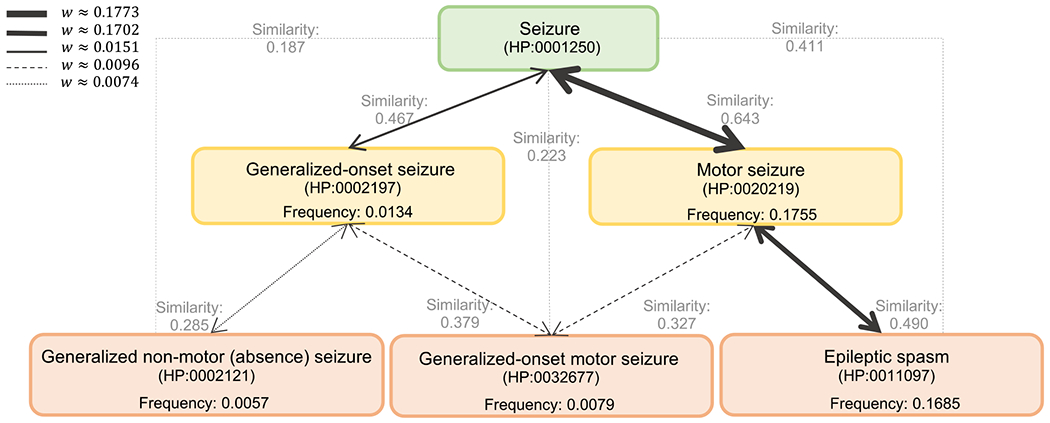
Figure 3. An illustration of the weighting mechanism on a portion of the HPO.

The thickness of an edge represents its weight. Stronger weights have a higher chance of being selected by the biased random walks in the sampling algorithm. The propagated frequency values are calculated as described in Section 2.3. The cosine similarity values between each phenotypic pair are shown in gray. Higher similarity values represent a higher degree of closeness in the embedding space.
