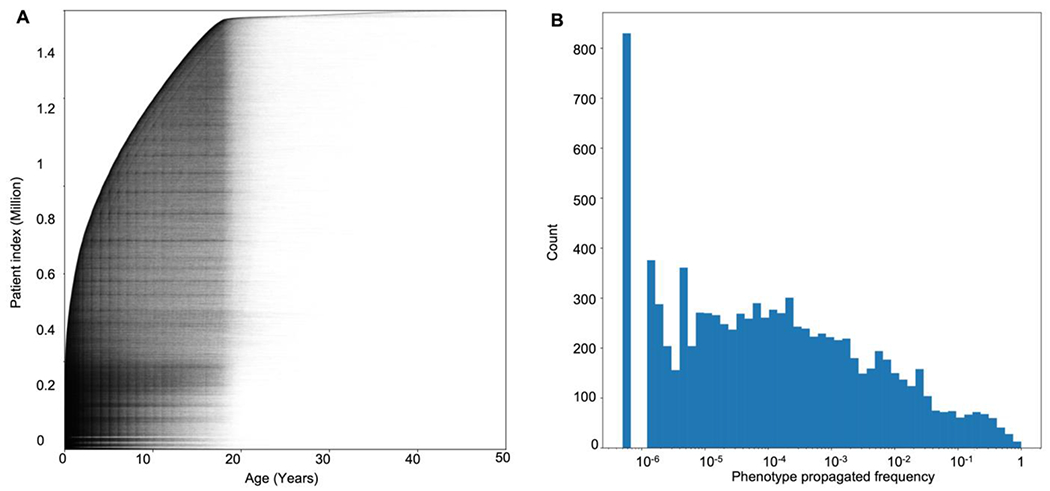
Figure 4. More than 53 million patient health records can be translated into phenotypes.

(A) Individual data points in the Arcus Data Repository used in our analysis (n = 53,955,360). The X-axis shows patients’ age at the time of the encounter, and the Y-axis represents patients’ indices stacked and sorted by their age at the earliest encounter with a total of 1,504,582 individuals. (B) Histogram of the phenotypes’ propagated frequency available in the HPO, a total of 15,371 phenotypes. Note that the X-axis has a logarithmic scale, and the phenotypes with a frequency less than 10−6 were not available in any of the encounters ().
