
Figure 5. The HPO can be represented in a lower-dimensional space where similarities and differences between the phenotypes are preserved.
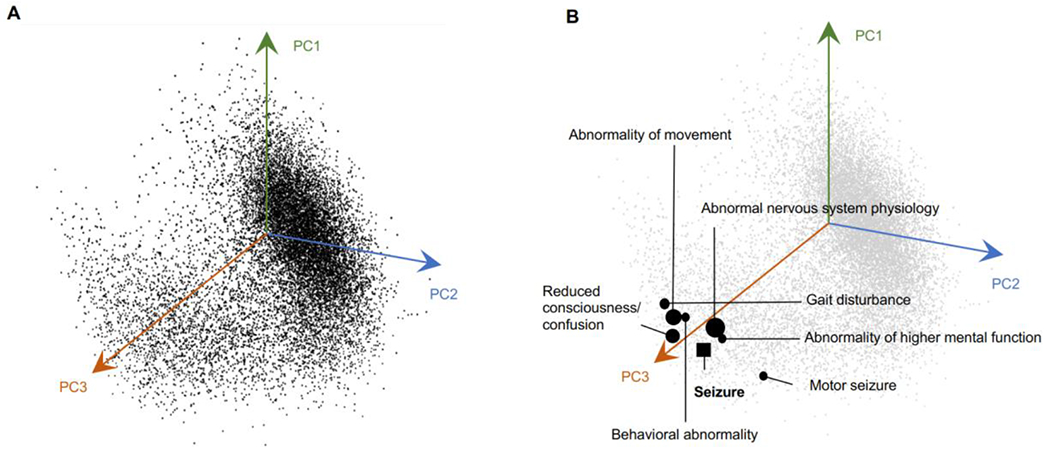
(A) A 3D representation of all phenotypes in the embedding space using the PCA algorithm. The axes are based on the first three principal component vectors (PC) of the PCA algorithm. (B) Seven closest phenotypes to Seizure (HP:0001250) are marked in the 3D space. Closer phenotypes in the original space (128D) are represented with larger circles.