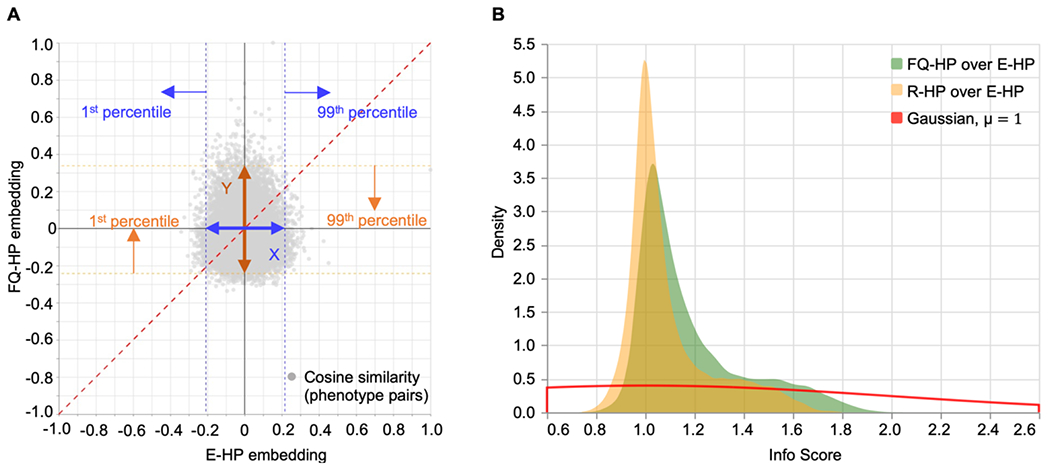
Figure 6. Incorporating phenotypes frequencies in the HPO graph transfers likelihood distribution to embeddings.

(A) Pair-wise cosine similarity changes between a sample phenotype, Seizure (HP:0001250), and all other phenotypes in the HPO using the FQ-HP and E-HP embedding methods. Info Score captures the similarity changes between these two methods by dividing the similarity range using FQ-HP by the similarity range using E-HP, i.e., Y/X. (B) A comparison between the PDF of the Info Score of FQ-HP over E-HP (shown in green) and the Info Score of Random Gaussian weights (R-HP) over E-HP (shown in yellow). The PDF of Info Score of FQ-HP/E-HP with a smaller peak around 1 and a longer tail indicates that FQ-HP could generate reliable phenotype clusters in the embedding space and shows the importance of assigning weights that represent the actual distribution of the phenotypes.
