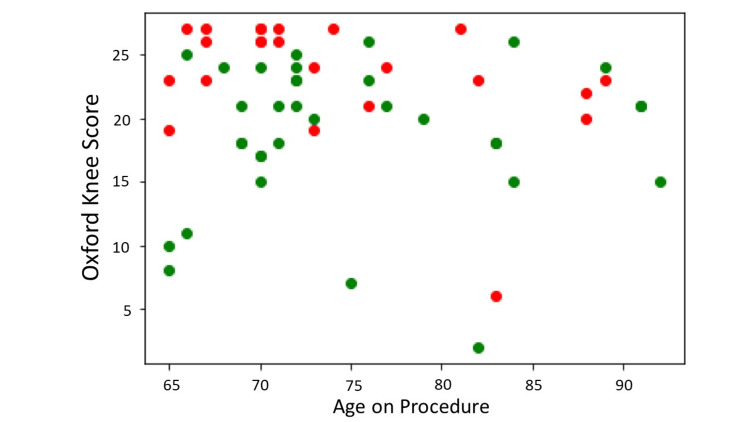
Figure 4. Test dataset.
X-axis = age on procedure; Y-axis = preoperative Oxford Knee Score; Green dots = responders with an improvement of ≥7 points in the Oxford Knee Score at year one; Red dots = non-responders with an improvement of <7 points in the Oxford Knee Score at year one. Source Dataset 1464/2021.

