Figure 2.

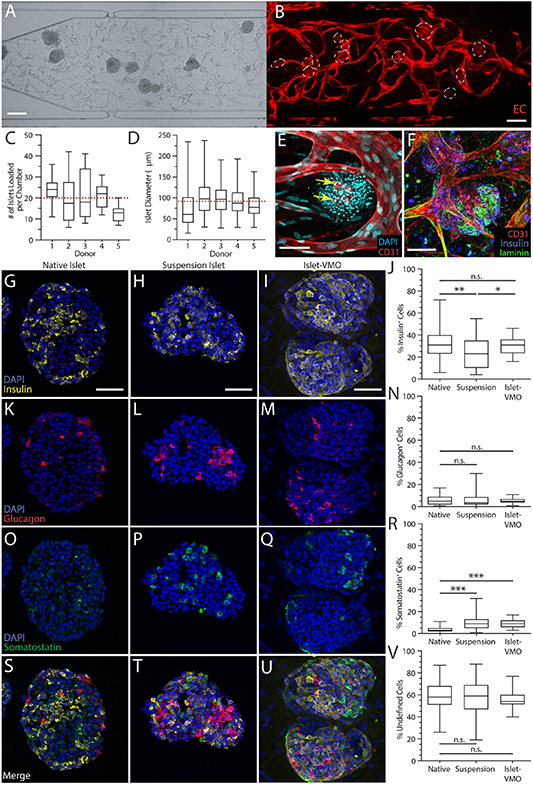
The islet-VMO platform supports islet-proximal vascularization and preserves islet cytoarchitecture. (A) Islets were loaded together with ECs and stromal cells such that even distribution of all populations are observed after loading. (B) Imaging of the same network after one week of maturation shows an intact vessel network (red, transduced ECs) around the embedded islets (dashed outline). Scale bar, 200 μm. (C) The average number of islets was quantified per chamber across five donors, yielding an average of 20 islets loaded per chamber (red dashed line). (D) Quantification of average islet diameter across the same islet set shows an average islet diameter of 87.9 μm (red dashed line) (n > 110 islets). Box and whisker plots represent median, 25th, and 75th percentiles (box) and min and max values (whiskers) for each data set. (E) Immunofluorescent staining for CD31-expressing endothelium (red) shows vessel formation immediately proximal to islets (DAPI, cyan). (F) Immunofluorescent staining of laminin (green) shows the presence of basement membrane surrounding islets (insulin, blue) and CD31+ endothelium (red). Scale bar, 75 mm. Immunofluorescent staining and quantification of (G)–(J) insulin+ β cells, (K)–(N) glucagon+ α cells, and (O)–(R) somatostatin+ δ cells was compared between cryosectioned native islets, cryosectioned islets maintained for one week in suspension culture, and in situ imaged islet-VMO-embedded islets (n > 45 islets across 8 donors). All images were acquired on a confocal microscope and represent maximal projections of the combined image stack. Scale bars, 50 mm. (S)–(U) Merged images of all staining and (V) quantitation of the unstained (non-endocrine) cells in each islet population.
