Figure 3.

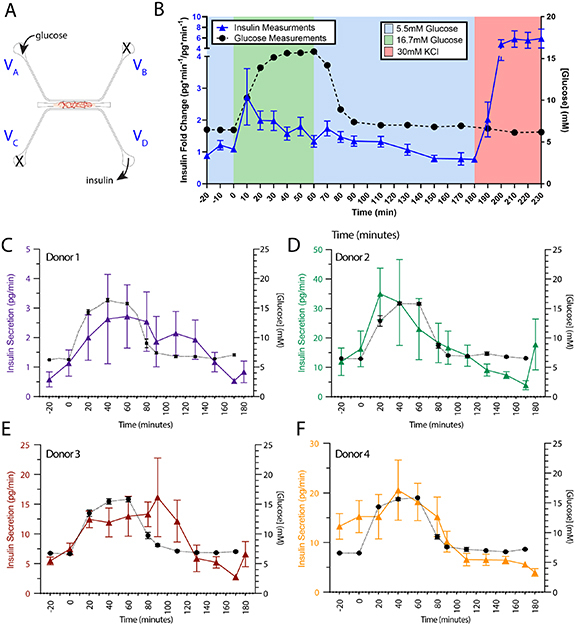
Glucose responsiveness of islet-VMO islets partially reflects in vivo glucose responsiveness. (A) To test islet response to glucose stimulation, medium supplemented with either basal (5.5 mM) or high (16.7 mM) glucose can be introduced through reservoir VA to stimulate islets by perfusion through the vascular network. Insulin and glucose is measured from effluent collected at reservoir VD. Reservoirs VB and VC are blocked so that all glucose flows through the vessel network and secreted insulin is not diluted by cross-flow from VC. (B) Perfused glucose (black dashed line) and secreted insulin (blue line) are measured at 10 min intervals from collected effluent and plotted over time (n = 19 Islet-VMOs containing islets from 6 different donors). Error bars represent SEM. (C)–(F) Traces of measured glucose (black dashed line) and insulin (colored lines) from individual donors show similar secretion patterns despite different magnitudes of insulin secretion (note different y-axis scale) (n ⩾ 3 Islet-VMOs per donor).
