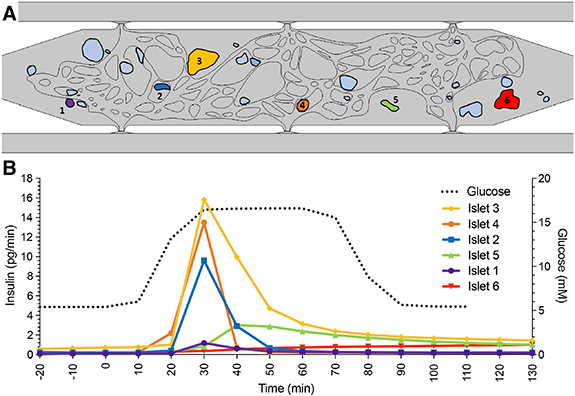
Figure 5.

Individual islet function modeled within the islet-VMO. Using the COMSOL model described in figure 4, (A) a selection of six islets (annotated and colored) were selected for measuring individual islet function. (B) Insulin secretion profile (colored lines matched to islet color) for each islet was modeled over the course of low and high glucose perfusion (black dashed line), showing variable islet responses depending on location within the chamber and proximity to perfused blood vessels.
