Figure 6.

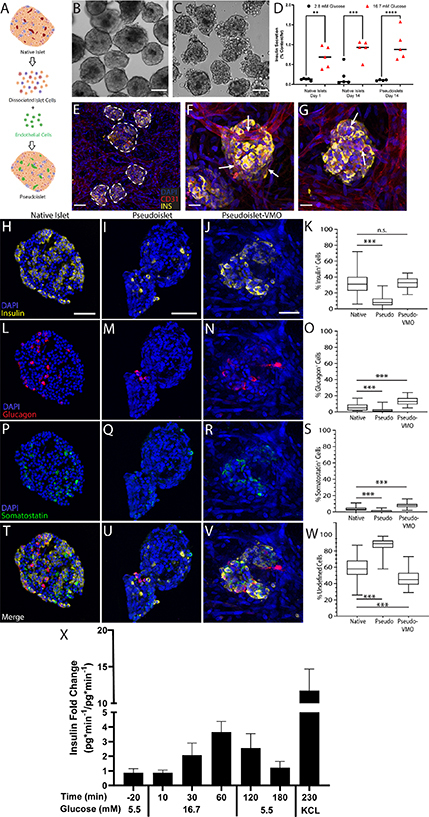
Intra-islet vasculature is enhanced in pseudoislets embedded within the islet-VMO. (A) To generate reconstituted islets, native islets were dissociated and reconstituted either as islet cells alone (reaggregated islets) or together with ECs (pseudoislets). Created with BioRender.com. (B)–(C) Islet morphology was compared by phase contrast microscopy two days post-reconstitution between (B) native islets and (C) pseudoislets. Scale bar, 100 μm. (D) Static glucose-stimulated insulin secretion (GSIS) was measured for each islet population under unstimulated (2.8 mM glucose) and stimulated (16.7 mM) conditions (two-way ANOVA, significance: ns, not significant; **p < 0.01; ***p < 0.001). (E) Pseudo-islets were loaded together with EC and stromal cells and vessel networks allowed to form. ECs (CD31+, red) form an interconnected network that surrounds and penetrates the pseudoislets (DAPI, cyan, dashed outline). Scale bar, 100 mm. (F)–(G) CD31 staining shows vessels penetrating pseudo-islets (white arrows). Scale bar, 25 μm. Immunofluorescent staining and quantification of native islets, pseudoislets after reconstitution, and pseudoislets maintained in the islet VMO for one week (pseudo-VMO) for (H)–(K) insulin+, (L)–(O) glucagon+, and (P)–(S) somatostatin+ cells. Scale bar, 50 μm. (Student’s t-test, n.s., not significant; ***p < 0.0001). (T)–(W) Merged images of staining in all islet types and (Y) quantitation of undefined (non-endocrine) islet cells. (X) Secreted insulin at listed timepoints collected over a 10 minute interval (n = 7 Islet-VMOs containing islets from 2 different donors). Error bars represent SEM.
