Figure 7.

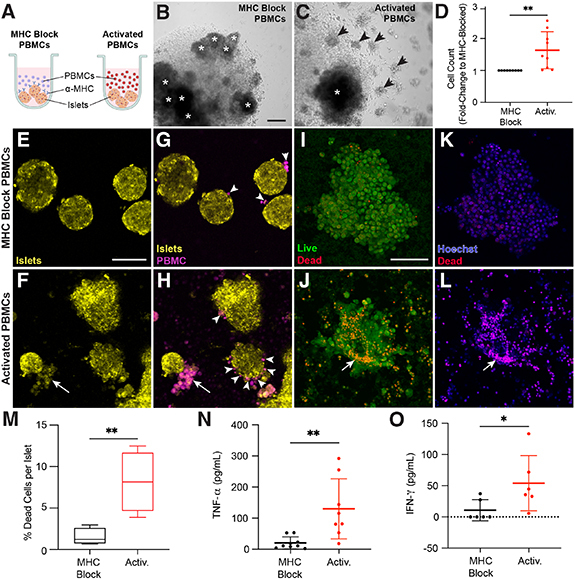
PBMCs are activated against donor islets. (A) MHC blocked and activated PBMCs were generated by incubating PBMCs with donor islets and IL-2 + IFN-g (activation cocktail) in round-bottom 96-well plates. MHC blocked conditions also contained antibodies against both MHC Class I and II. Schematic created with BioRender.com. After 5 d under these conditions, PBMCs cultured in the (B) presence or (C) absence of MHC-blocking antibodies demonstrates clonal expansion (activation) only in the absence of MHC-blocking antibodies. Islets are annotated by asterisks (*) and grape-like clusters annotated by arrowheads. Scale bar, 200 μm. (D) Quantification of activated PBMCs (red) as a fold-change relative to MHC blocked PBMCs (black) after five days of activation. These MHC blocked and activated PBMCs were isolated and incubated with islets from the same donor for 48 h. (E)–(H) Islets (yellow) and PBMCs (magenta) were stained with different CellTracker dyes and imaged for interactions between the two after 48 h incubation in a chamber slide. Islets exposed to activated but not MHC blocked PBMCs show morphological damage Scale bar, 50 μm (E), (F). (G) MHC blocked PBMCs show minimal affinity for islets (white arrowheads) whereas (H) activated PBMCs show increased adhesion to islets and, in some cases, destruction of islet tissue (white arrows). (I)–(L) Islets from the same conditions were stained with live/dead stain. (I), (J) Morphological damage is evident in islets exposed to activated but not MHC blocked PBMCs (arrow indicates islet damage). (K), (L) Dead cell staining (red) shows increased dead cells in islets exposed to activated but not MHC-blocked PBMCs. (M) Quantification of dead cell labeling (red) versus Hoechst (nuclei, blue) staining in islets exposed to MHC blocked (black) or activated (red) PBMCs (Student’s t-test, **p < 0.01) (n = 30 islets across 4 donors). Supernatant was collected from these co-incubations and measured for secreted (N) TNF-α and (O) IFN-γ relative from MHC blocked (black) and activated (red) PBMCs. Statistical significance determined by Student’s t-test (significance: *p < 0.05, **p < 0.01).
