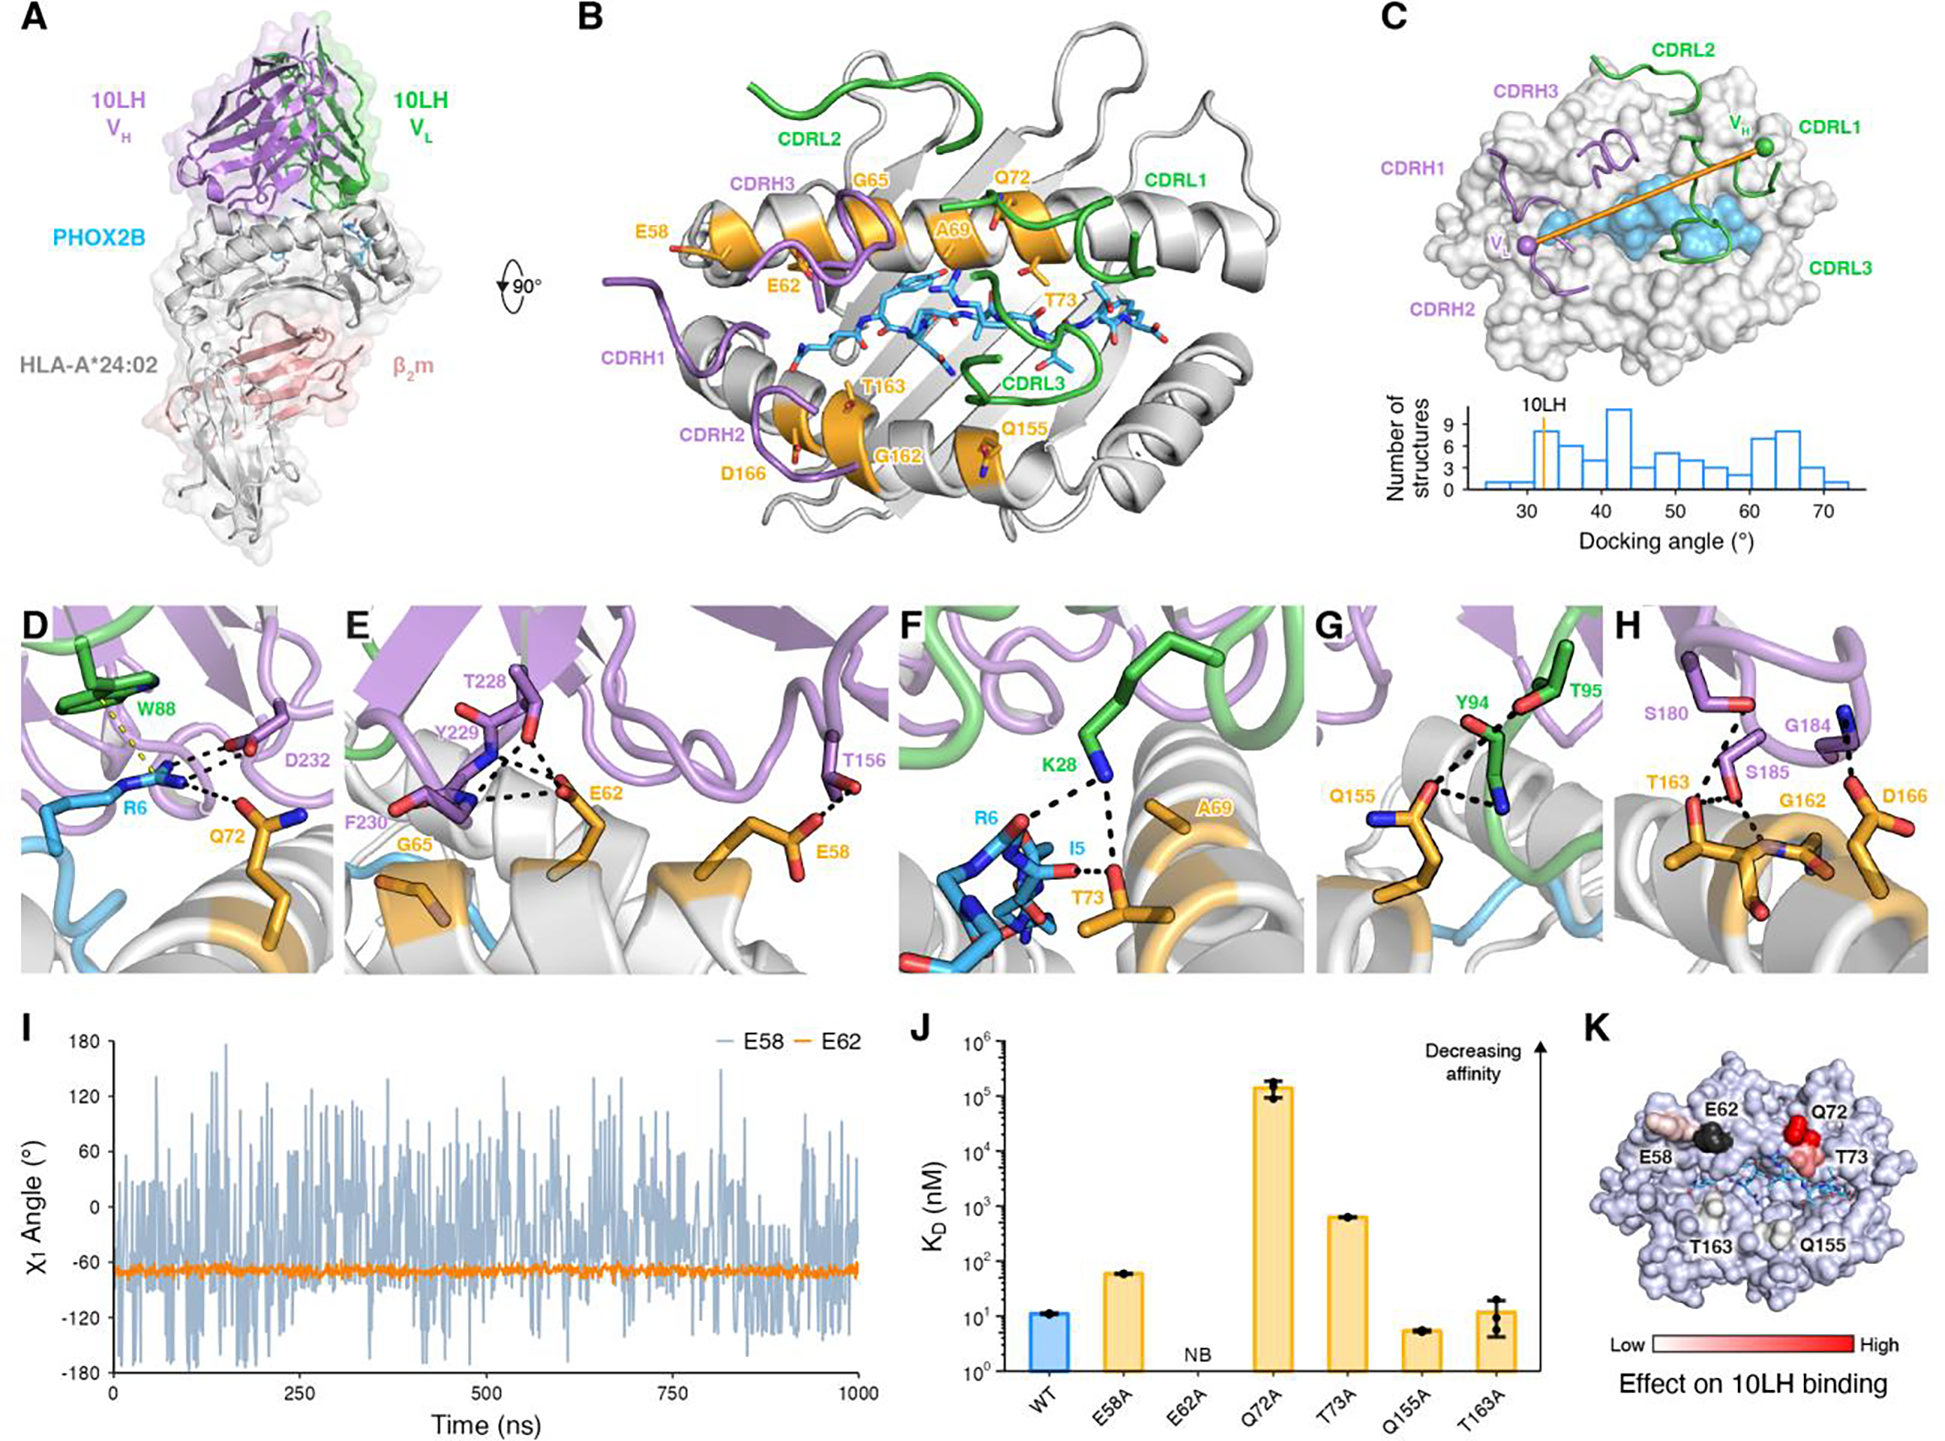
Fig. 1. Structural basis for high-affinity 10LH:PHOX2B/HLA-A*24:02/β2m complex formation.

(A) Crystal structure of the 10LH:PHOX2B/HLA-A*24:02/β2m complex (PDB ID 8EK5). Surface representation is shown in lighter shades. The PHOX2B peptide is shown as sticks. (B) Top-down view of the structure shown in (A). The 10LH CDR loops are shown as cartoon tubes. The HLA framework residues (orange) and the PHOX2B peptide (blue) are shown in sticks. (C) Top-down view of 10LH:PHOX2B/HLA-A*24:02/β2m shown in surface representation. The 10LH interdomain vector is drawn between the centroids of the conserved disulfide bonds in the heavy (purple) and light (green) chains. A histogram of TCR docking angles is calculated using the TCR interdomain vectors. The corresponding value for 10LH is indicated by an orange line at 32.2°. (D-H) Close-up view of 10LH and PHOX2B/HLA-A*24:02/β2m interactions for the R6 in PHOX2B (D) and the framework residues along the α1 (E, F) and α2 (G, H) HLA helices. Hydrogen bonds and cation-π interactions are indicated by black and yellow dashed lines, respectively. (I) The χ1 side chain torsion angle from MD simulations of the 10LH:PHOX2B/HLA-A*24:02 complex for E58 and E62. Data are mean across n = 3 independent 1 μs runs. (J) SPR determined KD values for 10LH:PHOX2B/HLA-A*24:02/β2m with alanine mutated framework residues. Data are mean ± SD for n = 3 technical replicates. KD, equilibrium dissociation constant; NB, no binding. (K) The fold change of KD for the alanine mutated 10LH:PHOX2B/HLA-A*24:02/β2m compared to the WT mapped on the HLA-A*24:02 surface. E62A (no binding) is colored black.
