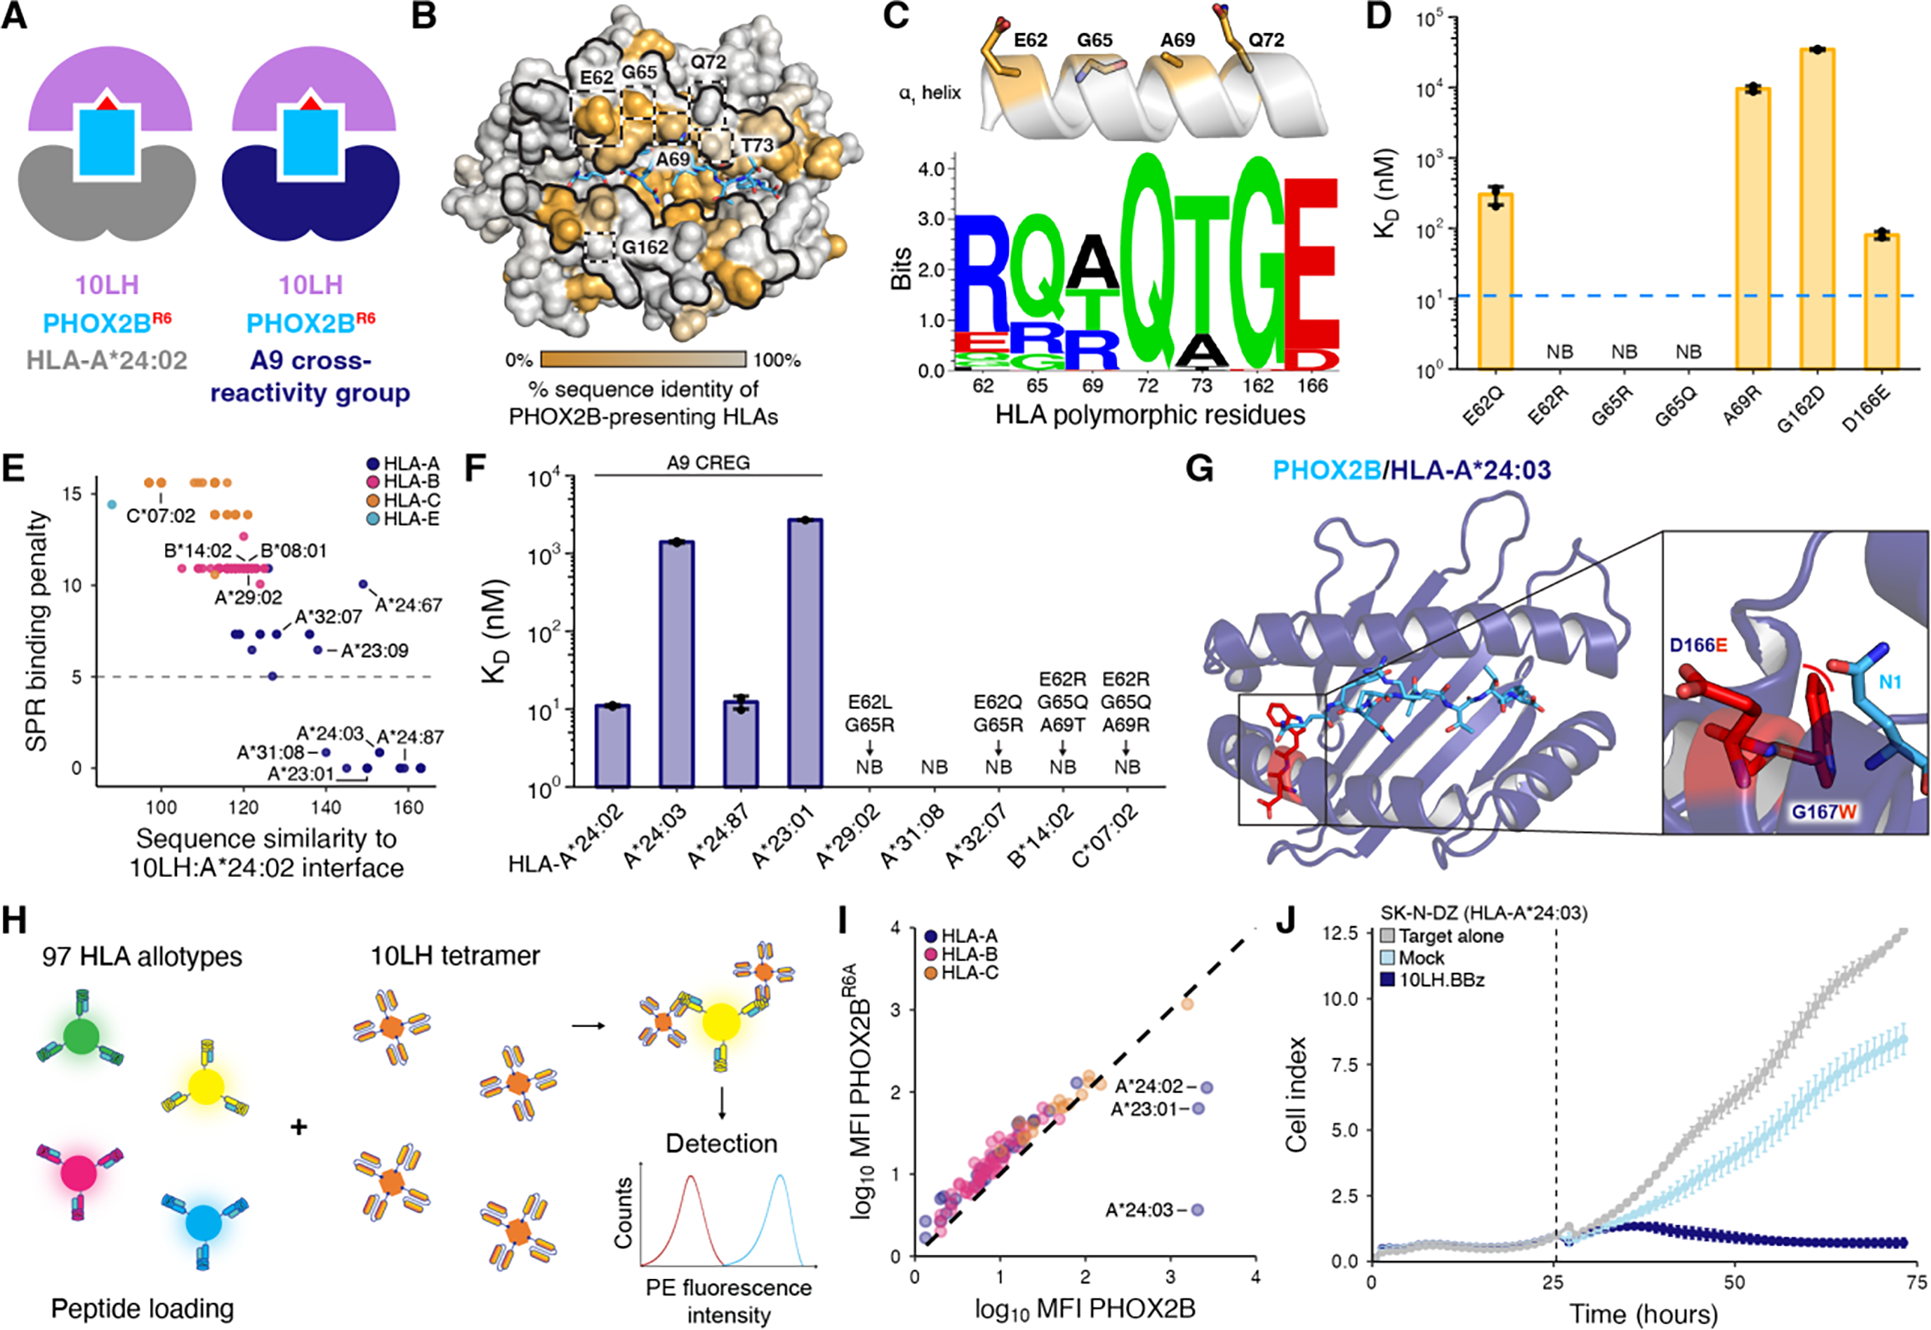
Fig. 2. Key framework residues on HLA molecules confer allelic interactions with 10LH.

(A) Schematic depicting cross-HLA interactions by 10LH. (B) Sequence identity across 219 HLA-I alleles computationally predicted to present the PHOX2B peptide mapped onto the HLA-A*24:02 surface (PDB ID 8EK5). The α1 and α2 helices and HLA framework residues are denoted by the black outlines and dashed boxes, respectively, on the HLA-A*24:02 surface. (C) Schematic depicting the HLA framework residues on the α1 helix. Below, a sequence motif of the HLA framework residues across common alleles predicted to bind the PHOX2B peptide (n = 219). Created using Seq2Logo. (D) SPR determined KD values for PHOX2B/HLA-A*24:02/β2m with site-directed mutations of the framework residues. Data are mean ± SD for n = 3 technical replicates. The blue dashed line depicts the KD of the WT PHOX2B/HLA-A*24:02/β2m to 10LH. (E) Scatter plot of sequence similarity of HLA interface residues (BLOSUM62 score) against the SPR binding penalty for the predicted 10LH binders. The SPR binding penalty was calculated by adding the log base 10 ratio of the mean KD value for each polymorphism in a given allele to the wild-type KD. The gray dashed line indicates the presence of at least one non-binding polymorphism. (F) SPR determined KD values for selected HLA allotypes. Polymorphisms among the framework residues are listed above non-binding alleles. Data are mean ± SD for n = 3 technical replicates. NB, no binding. (G) Structural model of PHOX2B/HLA-A*24:03 with polymorphisms relative to HLA-A*24:02 denoted in red sticks. The zoom-in details the steric clash (red curve) between the polymorphic residue (red) and the PHOX2B peptide (blue). (H) A summary of SAB screening, where beads are pre-incubated over weekend (o/w) with PHOX2B or PHOX2BR6A peptides, and stained by 10LH PE-tetramers for a shift in MFI. (I) Correlation of log10(MFI) for 10LH stained HLA allotypes pre-incubated with PHOX2B and PHOX2BR6A. Data are mean for n = 3 technical replicates with SD and individual data points are shown in fig. S12. The black dashed line represents a conceptual 1:1 correlation (no difference between PHOX2B- and PHOX2BR6A-dependent 10LH interactions). (J) In vitro cytotoxic activity of 10LH.BBz CAR T cells against HLA-A*24:03 neuroblastoma cell line SK-N-DZ. 10LH.BBz CAR T cells were co-cultured (black dashed line indicates addition of effector cells to target cells) at a 3:1 E:T ratio with SK-N-DZ target cells. Target cell viability was determined using the cell index of the xCELLigence Real-Time Cell Analysis (RTCA) system. Target cell index was normalized to the timepoint immediately before addition of effector cells. Values represent mean ± SD using effector cells from n = 2 biological donors, in triplicates.
