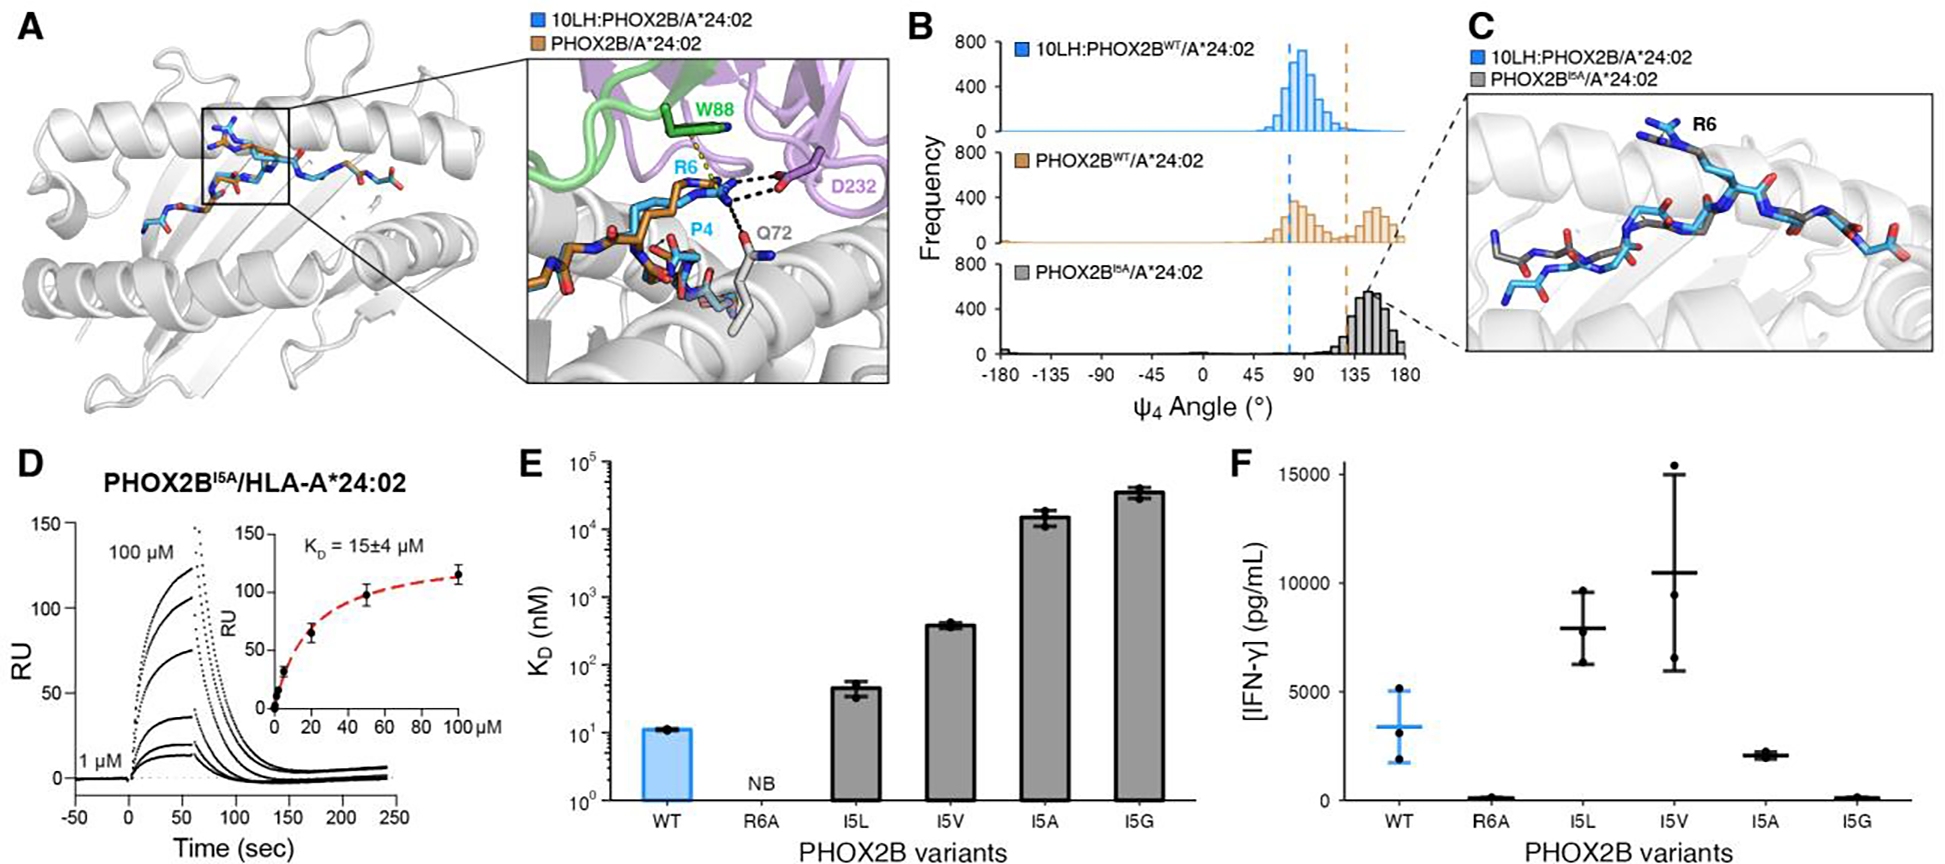
Fig. 3. PHOX2B conformational adaptations enable high affinity complex formation with 10LH.

(A) Structural superimposition of PHOX2B/HLA-A*24:02 in the bound (blue; PDB ID 8EK5) and unbound (brown; PDB ID 7MJA) states. The peptides were aligned using their backbone heavy atoms (RMSD = 0.52 Å). The zoom-in details the difference in the R6 side chain conformation and the peptide backbone. (B) Histogram depicting the frequency of Ψ4 backbone dihedral angle values for MD simulations of the bound (blue) and unbound (brown) PHOX2B/HLA-A*24:02 structures as well as the PHOX2BI5A/HLA-A*24:02 unbound variant (black). The dashed lines correspond to the values in the crystal structures (10LH:PHOX2B/HLA-A*24:02/β2m, PDB ID 8EK5; PHOX2B/HLA-A*24:02, PDB ID 7MJA). Data represent 3000 equally-spaced frames from a sum of n = 3 independent 1 μs runs. (C) Representative structure from a frame of PHOX2BI5A/HLA-A*24:02 (black) MD simulations superimposed onto the 10LH:PHOX2B/HLA-A*24:02/β2m (blue) crystal structure. The peptides were aligned using all atoms (RMSD = 1.19 Å). (D) Representative SPR sensorgram of PHOX2BI5A/HLA-A*24:02 flowed over a streptavidin chip coupled with 10LH-biotin. The concentrations of analyte for the top and the bottom sensorgrams are noted. Data are mean ± SD for n = 3 technical replicates. Fits from the kinetic analysis are shown with red lines. KD, equilibrium constant; RU, resonance units. (E) SPR determined KD values for HLA-A*24:02 loaded with I5 mutational scanned peptides. Data are mean ± SD for n = 3 technical replicates. NB, no binding. (F) IFN-γ levels in supernatant of 10LH.BBz CAR T cells co-cultured with HLA-A*24:02 colorectal adenocarcinoma cell line SW620 pulsed with PHOX2B peptide variants. Exogenous peptide was added to SW620 target cells (15 μM final concentration). After four hours of incubation, 10LH.BBz CAR T cells were added to target cells at a 3:1 ET ratio. Supernatant was collected 24 hours post effector cell addition and IFN-γ levels were measured by ELISA. Values represent mean ± SD using effector cells from n = 3 biological donors, in triplicates.
