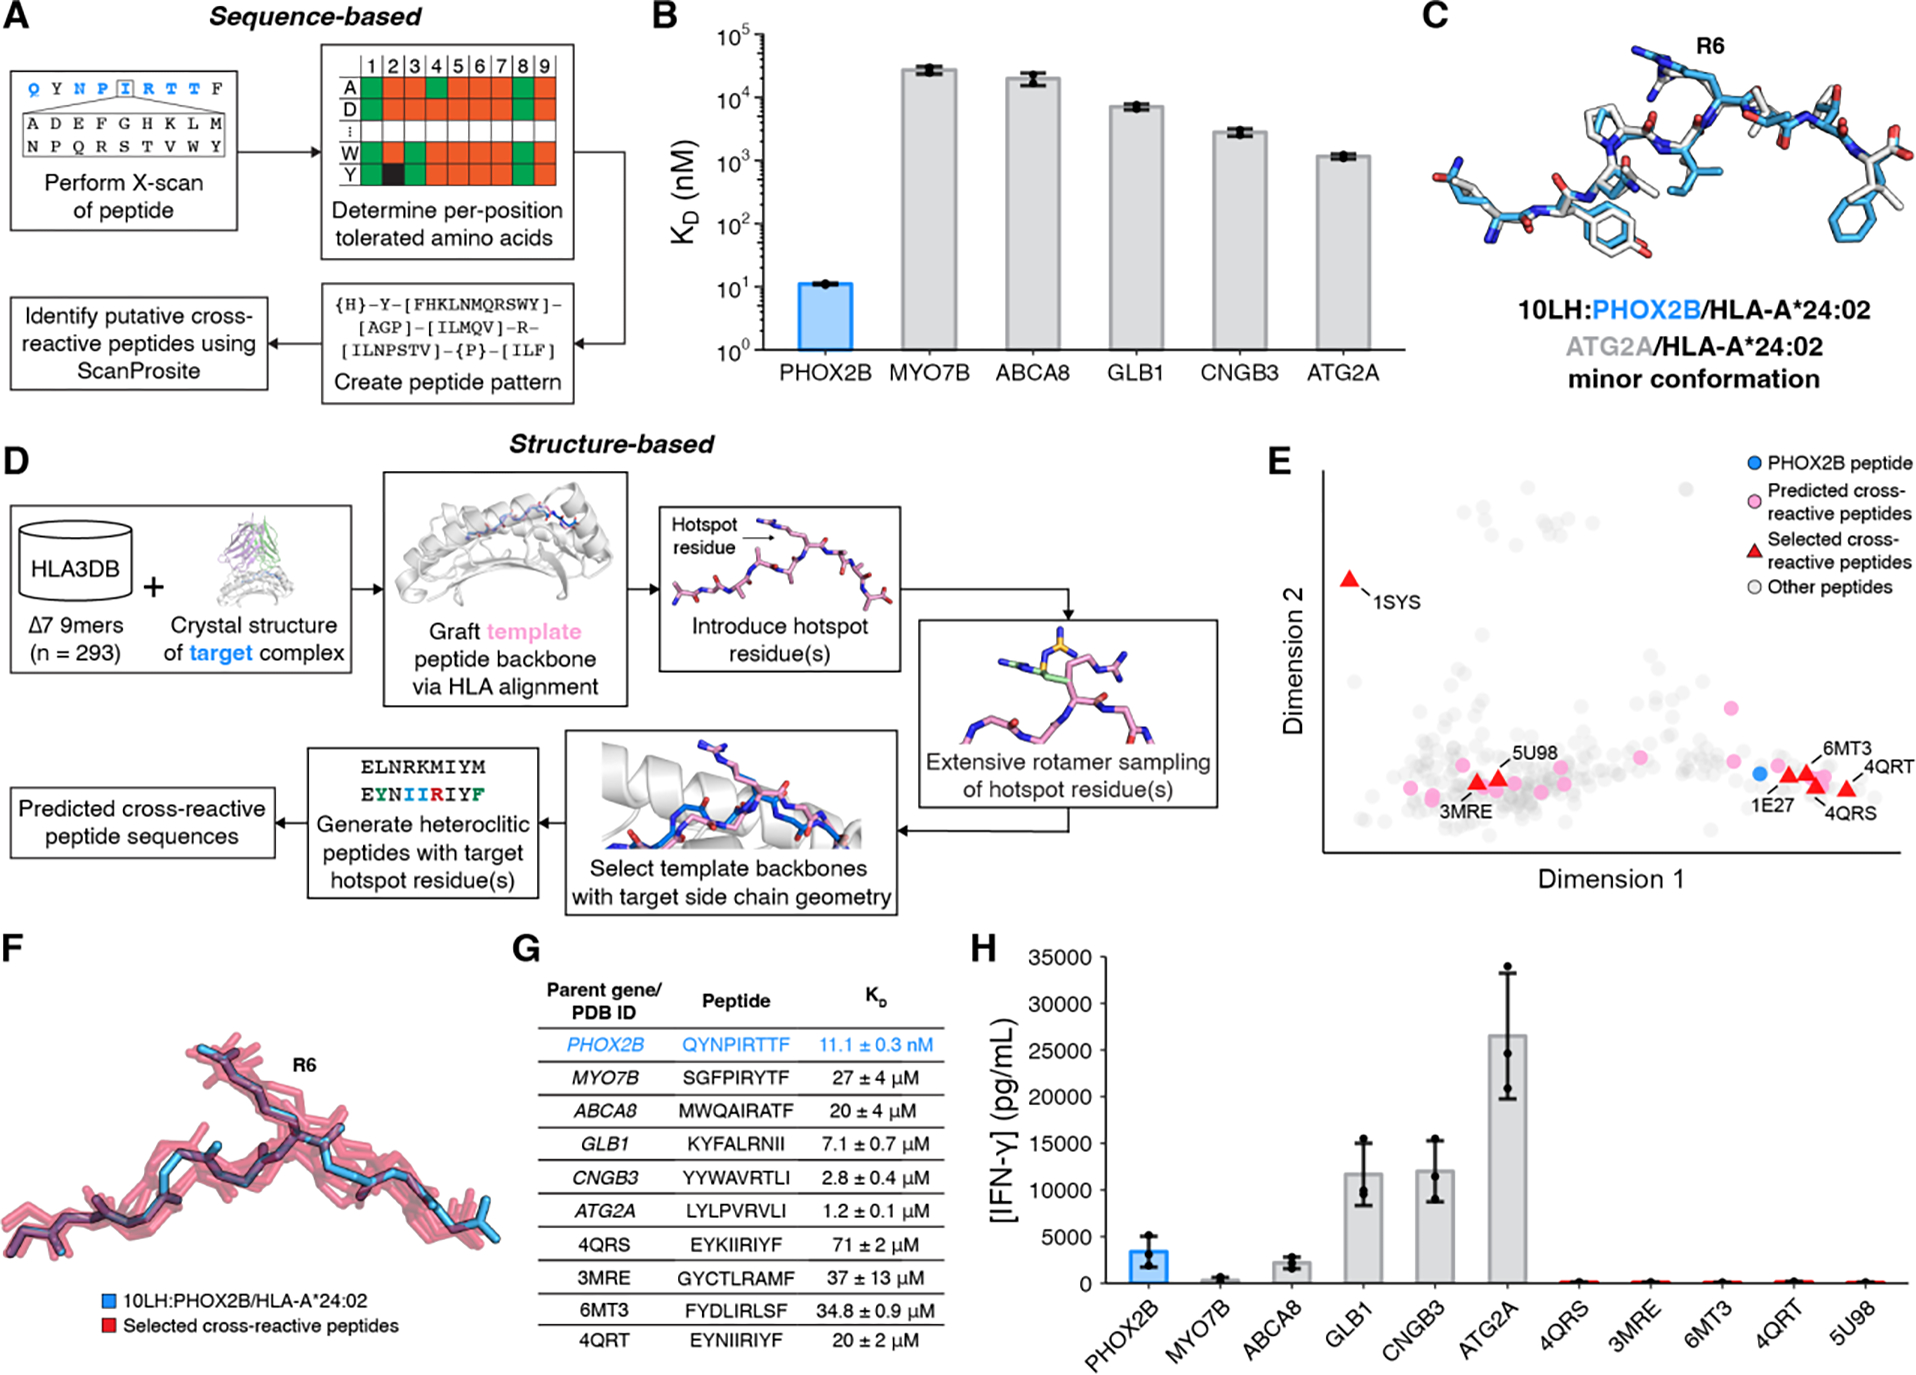
Fig. 4. Mapping the 10LH/peptide cross-reactivity landscape.

(A) Summary of sequence-based prediction of cross-reactive peptides by X-scan/ScanProsite: (1) perform X-scan on target peptide; (2) determine per-position tolerated amino acids; (3) create peptide pattern; (4) identify putative cross-reactive peptide using ScanProsite. (B) SPR determined KD values for cross-reactive peptides. Data are mean ± SD for n = 2 technical replicates. (C) Structural superimposition of the 10LH:PHOX2B/HLA-A*24:02/β2m peptide (blue; PDB ID 8EK5) with the minor conformation of the 3.1 Å structure of ATG2A/HLA-A*24:02 (white; PDB ID 8SBL). The peptides were aligned using their backbone heavy atoms (RMSD = 0.86 Å). (D) Summary of structure-based prediction of cross-reactive peptides: (1) graft template peptide backbones from HLA3DB; (2) introduce hotspot residues; (3) conduct extensive rotamer sampling; (4) select template backbones with target side chain geometry; (5) generate heteroclitic peptides with target hotspot residues and conserved backbone; (6) obtain a set of predicted cross-reactive peptides. (E) PCA plot of the conformational landscape of peptide backbones. The PCA transformation explains 66% of the variation. (F) Structural superimposition of selected, predicted cross-reactive peptide backbones (red) to the PHOX2B backbone (blue) with the side chain of R6 shown. The peptides were aligned using HLA Cα atoms. (G) Table of cross-reactive peptide sequences with their origin and SPR-determined KD values. Data are mean ± SD for n = 2 or 3 technical replicates. (H) IFN-γ levels in supernatant of 10LH.BBz CAR T cell co-cultured with HLA-A*24:02 colorectal adenocarcinoma cell line SW620 pulsed with cross-reactive peptides. Exogenous peptide was added to SW620 target cells (15 μM final concentration). After four hours of incubation, 10LH.BBz CAR T cells were added to target cells at a 3:1 ET ratio. Supernatant was collected 24 hours post effector cell addition and IFN-γ levels were measured by ELISA. Values represent mean ± SD using effector cells from n = 3 biological donors, in triplicate.
