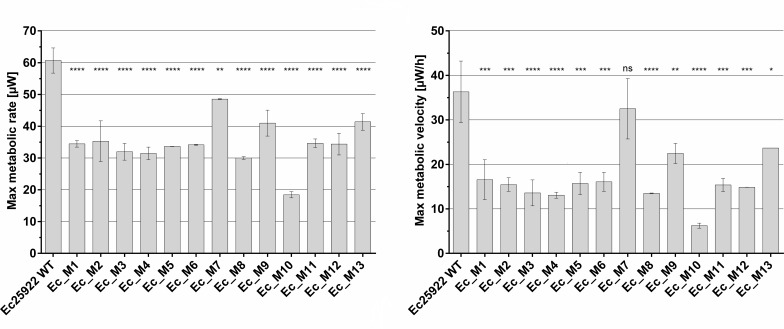
Fig 2.
Microcalorimetry reveals significant impact of NTXR on metabolic activity of E. coli. Peak heat flow (max. metabolic rate, left) and maximal change in heat flow (max. metabolic velocity, right) were determined following CalScreener analysis (n = 2), mean and standard deviation are shown. Samples were compared using one-way ANOVA with Dunnett’s multiple comparison test in GraphPad; *P < 0.05, **P < 0.01, ***P < 0.001, ****P < 0.0001.

