Fig 4.

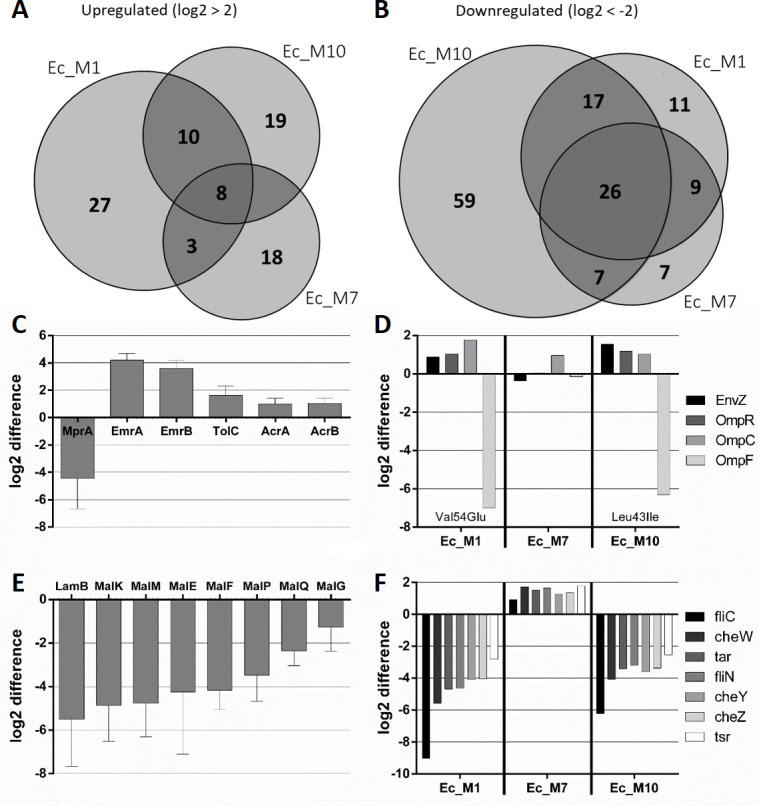
NTXR strongly affects protein expression in E. coli. Venn diagrams of all three tested mutants and their significantly upregulated (A) or downregulated (B) proteins with the threshold indicated above the diagram. Expression differences in AMR-related efflux systems (C) EnvZ-OmpR system (D) maltose uptake system (E), and Chemotaxis-related proteins (F) are displayed as log2 difference from all three selected mutants compared to wild-type E. coli ATCC25922. For (C) and (E), mean and SD are shown. In (D), envZ mutations of the respective mutant are indicated within the diagram. Cells were harvested (n = 4 per condition) in early stationary phase and prepared for full proteome extraction followed by analysis via DIA-NN and Perseus.
