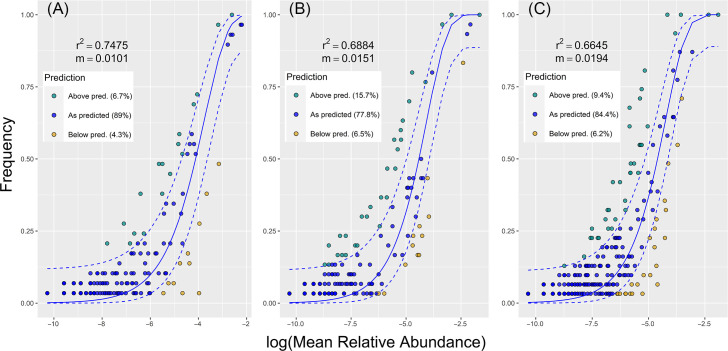
Fig 4.
Fit of the neutral community model (NCM) of fungal community assembly for (A) gall surface, (B) gall interior, and (C) larvae predicted occurrence frequencies for x and y. Solid blue lines indicate the best fit for the NCM according to Sloan et al. (45), and the dashed blue lines represent 95% confidence intervals (CIs) around the model prediction. Fungal species that occur more or less frequently than predicted by the NCM are shown in different colors. m = metacommunity size ×immigration; r2 = the goodness of fit of this model (coefficient of determination).

