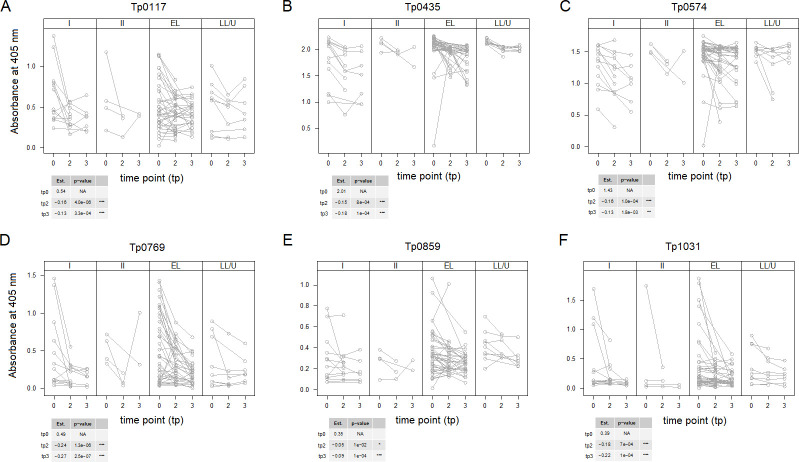
Fig 4.
Longitudinal reactivity to selected T. pallidum antigens without considering covariates. Antigens to which sera reactivity decreased significantly post-treatment. Time points 0, 1, and 2 include baseline sera (tp0) and convalescent sera collected at 3 months [time point 2 (tp2)] and 6 months [time point 3 (tp3)] post-treatment. Values are displayed by stage to minimize overplotting. Antigens are reported in gene number order. In the tables associated to each figure panel, the “Est” column reports the mean reactivity for all samples at baseline (tp0 row) and the amount by which antigen reactivity declined at tp2 and tp3 compared to baseline. Asterisks indicate significance with Bonferroni-adjusted P-values ≤0.001 (***), ≤0.01 (**), and ≤0.05 (*). A total of 66 samples were analyzed for tp0, 51 samples for tp2, and 44 people at tp3, as not all tp3 patients provided a sample at 3 months post-treatment. The steepest declines were seen for Tp0769 (D) and Tp0117 (A).

