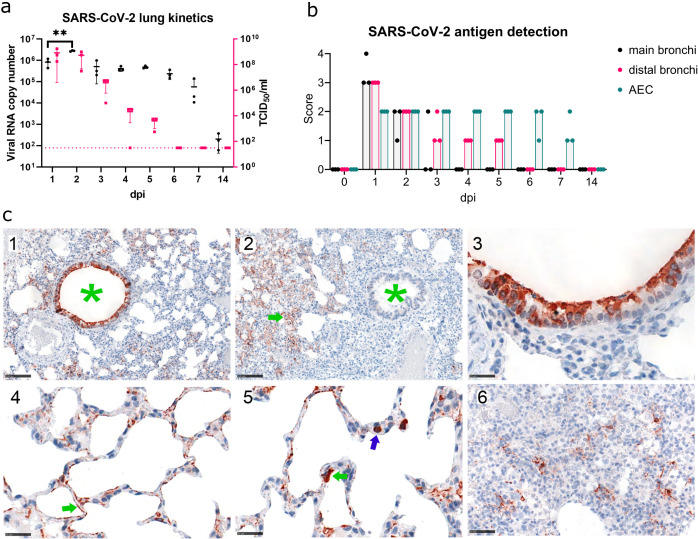
Fig 1.
Virological and histopathological characterization of SARS-CoV-2 lung infection time course. (a) SARS-CoV-2 kinetics in hamster lungs. Viral RNA copy number (Log10) (black, left axis) and replication-competent virus (Log10 TCID50/mL; magenta, right axis) detected in the lung samples. Each point represents the data from approximately 1.5 mm3 sample from the right cranial lobe of one animal. The dotted line indicates the detection limit for replication-competent virus. (b) Immunohistochemical analysis of SARS-CoV-2 NP antigen distribution in lung tissue. Viral antigen score in main bronchi, distal bronchi, and alveolar epithelial cells (AEC), control or 1–14 days post-infection (dpi). Dots, individual animals; bar, median. Brown—NP. Scores correspond to 0 = no antigen, 1 = rare, <5% antigen labeling per slide; 2 = multifocal, 6%–40%; 3 = coalescing, 41%–80%; 4 = diffuse, >80%. (c) 1—Viral antigen distribution at 1 dpi showing strong labeling in bronchi (green asterisk) and AEC. Bar 100 µm. 2 —Viral antigen distribution at 5 dpi, showing labeling restricted to AEC (green arrow), no labeling in bronchi (green asterisk). Bar 100 µm. 3—Viral antigen in cells morphologically consistent with ciliated bronchial epithelium at 1 dpi. Bar 25 µm. 4—Viral antigen in cells morphologically consistent with type 2 pneumocytes (green arrow) at 1 dpi. Bar 25 µm. 5—Target cell, viral antigen in cells morphologically consistent with type 1 pneumocytes (green arrow), also intravascular cells (blue arrow) are labeled, interpreted to be monocytes/macrophages taking up viral antigen at 1 dpi. Bar 25 µm. 6—Viral antigen clearing, scattered between proliferating pneumocytes and infiltrating immune cells, and the antigen is found at 7 dpi. Bar 50 µm. n = 3 animals per time point.

