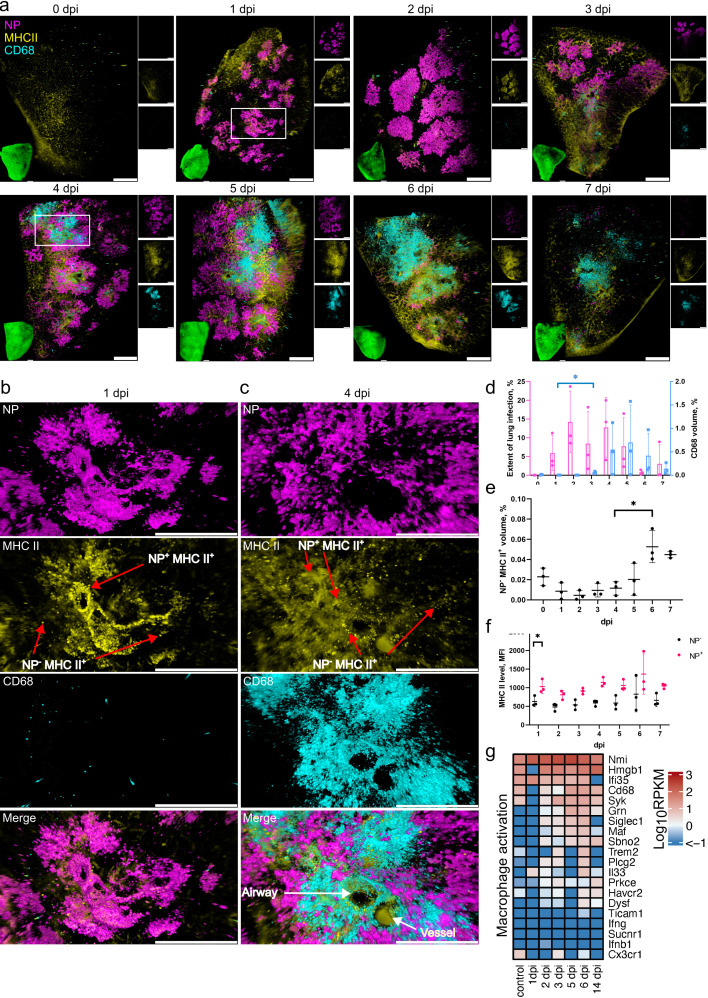
Fig 2.
SARS-CoV-2 lung infection leads to an influx of MDM and MHC II upregulation in infected cells. (a) LSFM imaging of the infection time course and corresponding host responses. Lung tissues from three animals for each time point were optically cleared and stained for NP (magenta), MHC II (yellow), and CD68 (cyan). 3D transparency rendering with top view of samples oriented in xy plane at each time point. Large panels show overlays of NP, MHC II, and CD68. The bottom left inlay shows tissue autofluorescence (green). Small panels show fluorescence in individual channels: NP (top), MHC II (middle), and CD68 (bottom). Representative images from a single animal are presented. Bar 1,000 µm. White rectangles at 1 and 4 dpi correspond to detailed views in b and c, respectively. (b) Detailed view of an infected lung region at 1 dpi. (c) Detailed view of an infected lung region with a cluster of CD68+ cells at 4 dpi. The neighboring airway and blood vessels were distinguished by autofluorescence. Scale bar 500 µm. (d) LSFM quantification shows changes in NP (magenta, left axis) and CD68 (cyan, right axis) levels relative to total tissue volume during the post-infection time course. (e) LSFM quantification of NP− MHCII+ levels relative to total tissue volume. (f) LSFM quantification of MHCII mean fluorescence intensity (MFI) level in tissue regions positive and negative for NP. (g) Heat map depicting scaled mRNA expression of genes associated with macrophage activation. n = 3 animals per time point.

