Fig 3.
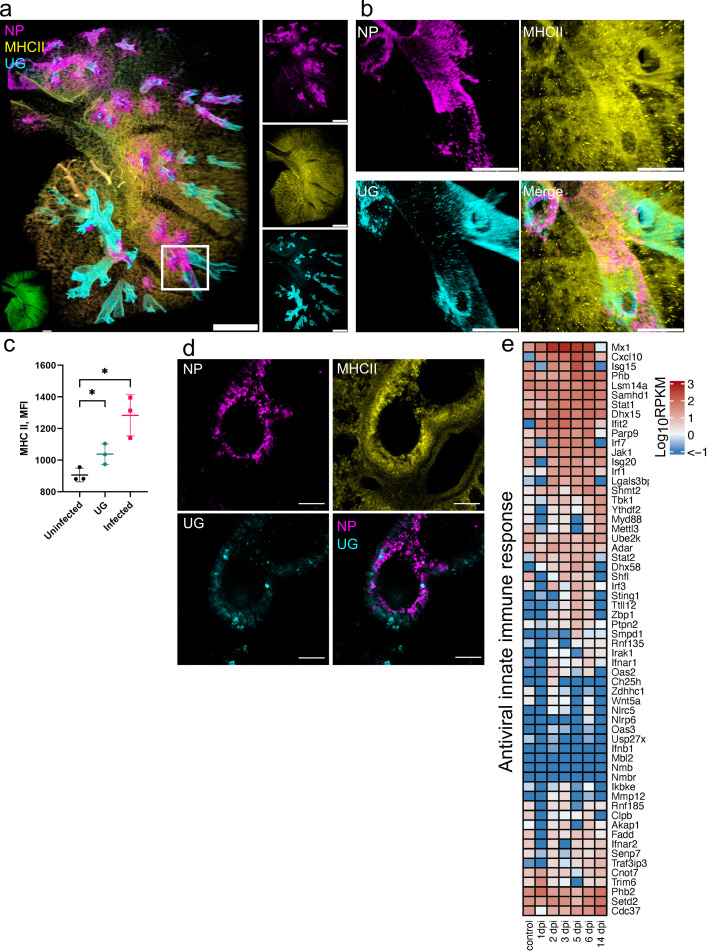
SARS-CoV-2 infection leads to a rapid MHC II upregulation in bronchial epithelium. (a) LSFM showing SARS-CoV-2 infection (NP, magenta), MHC II (yellow), and UG staining (cyan) at 1 dpi. 3D transparency rendering with top view of samples oriented in xy plane. The white rectangle corresponds to a detailed view of an infected airway region in b. The bottom left inlay shows tissue autofluorescence (green). Small panels show fluorescence in individual channels: NP (top), MHC II (middle), and UG (bottom). Representative images from a single animal are presented. Scale bar 1,000 µm. (b) Detailed view of an infected airway at 1 dpi. Scale bar 500 µm. (c) Quantification of MHC II level (MFI) in UG− uninfected tissue, UG+ tissue, and UG−-infected tissue. (d) Confocal imaging of hamster lung at 1 dpi. Maximum intensity projections of NP (magenta), MHC II (yellow), UG (cyan), and a merge of NP and UG. Scale bar 50 µm. (e) Heat map depicts scaled mRNA expression of genes associated with type I interferon responses and antiviral immune responses. n = 3 animals per time point.

