Fig 4.
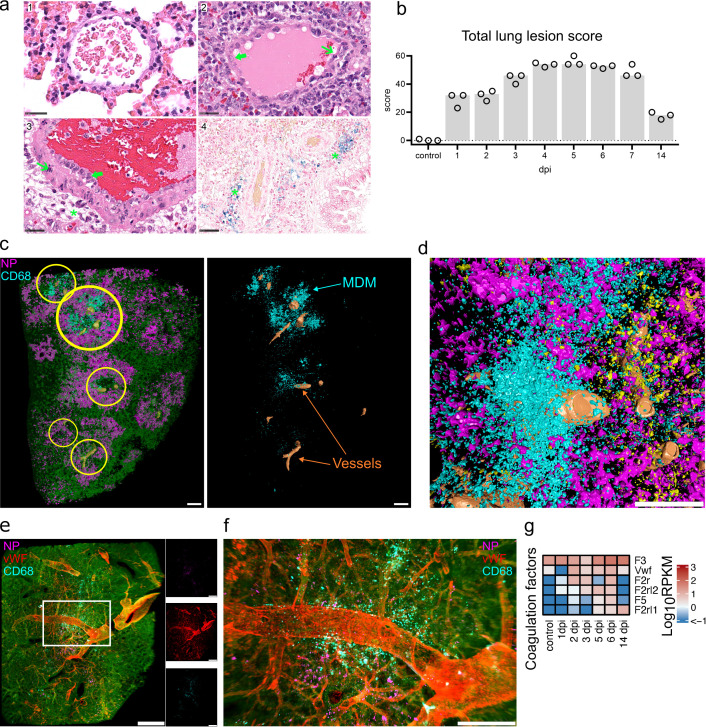
Tissue damage and MDM infiltration. Spatiotemporal analysis of tissue damage and necrosis. (a) Exemplary vascular changes in lung tissues in control animals and at 6 dpi. (1) Normal vein of control animals. (2) Vein of infected hamster, 6 dpi showing endothelial hypertrophy (green thick arrow) and necrosis (green slender arrow). (3) Artery of infected hamster, 6 dpi with endothelial hypertrophy (green thick arrow), necrosis within the vessel wall (green slender arrow), and perivascular inflammatory infiltrates with edema (green asterisk). (4) Blue-colored perivascular (green asterisk) hemosiderin deposition in infected hamsters 6 dpi. Edema and hemosiderin are consistent with vascular leakage. Hematoxylin and eosin staining, bar 25 µm (1–3) and Prussian blue staining, bar 50 µm (4). (b) Lung lesion scores. Particularly high scores were found on days 4–6. Total scores were composed of vascular lesion, inflammation, necrosis, and regeneration scores (Fig. S6). Detailed scoring criteria are given in Table S2. Bar, median. (c) Machine learning image analysis reveals clusters of infiltrating MDM near major blood vessels. Left: color-coded view of a processed LSFM lung tissue record at 4 dpi showing detection of lung tissue (green), major blood vessels (orange), MDM (cyan), and NP (magenta). Yellow circles indicate MDM clusters juxtaposed to blood vessels. Right: View of MDM and blood vessels only. Bar 500 µm. (d) Detailed view of MDM in the vicinity of lung vasculature at 5 dpi. Bar 500 µm. (e) LSFM imaging of NP and MDM clusters in relation to lung vWF+ vasculature at 5 dpi. 3D transparency rendering with top view of samples oriented in xy plane. The large panel shows the overlay of NP (magenta), vWF (red) and CD68 (cyan), and tissue autofluorescence (green). Small panels show fluorescence in individual channels: NP (top), vWF (middle), and CD68 (bottom). Representative images from a single animal are presented. Bar 1,000 µm. (f) Detailed view of MDM clusterining near vW+ vasculature (the image shows a region corresponding to the white rectangle in e). Bar 250 µm. (g) Heat map depicts scaled mRNA expression values of coagulation factors associated with extrinsic vessel damage. n = 3 animals per time point.

