Fig 5.
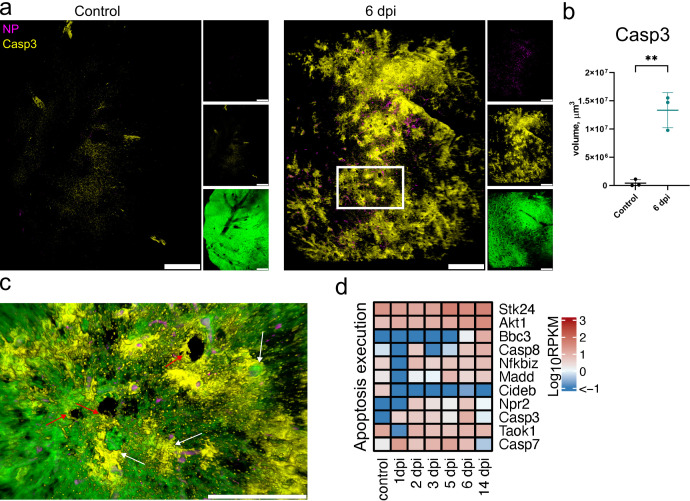
LSFM and transcription analysis of apoptosis following SARS-CoV-2 infection. (a) LSFM imaging of cleaved Caspase-3 (Casp3) in hamster lungs in control and at 6 dpi. 3D transparency rendering with top view of samples oriented in xy plane. Large panels show overlays of NP (magenta) and Casp3 (yellow). Small panels show fluorescence in individual channels: NP (top), Casp3 (middle), and tissue autofluorescence (bottom). Representative images from a single animal are presented. Bar 1,000 µm. The white rectangle corresponds to a detailed view in (c). Scale bar 1,000 µm. (b) LSFM quantification of Casp3+ tissue volume. (c) Detailed view of cleaved Casp3 and NP with tissue autofluorescence overlay at 6 dpi. White arrows indicate Casp3 staining near blood vessels, and red arrows indicate Casp3 staining near airways. Scale bar 500 µm. (d) Heat map depicts scaled mRNA expression of genes associated with apoptosis execution. n = 3 animals per time point.

