Fig 6.
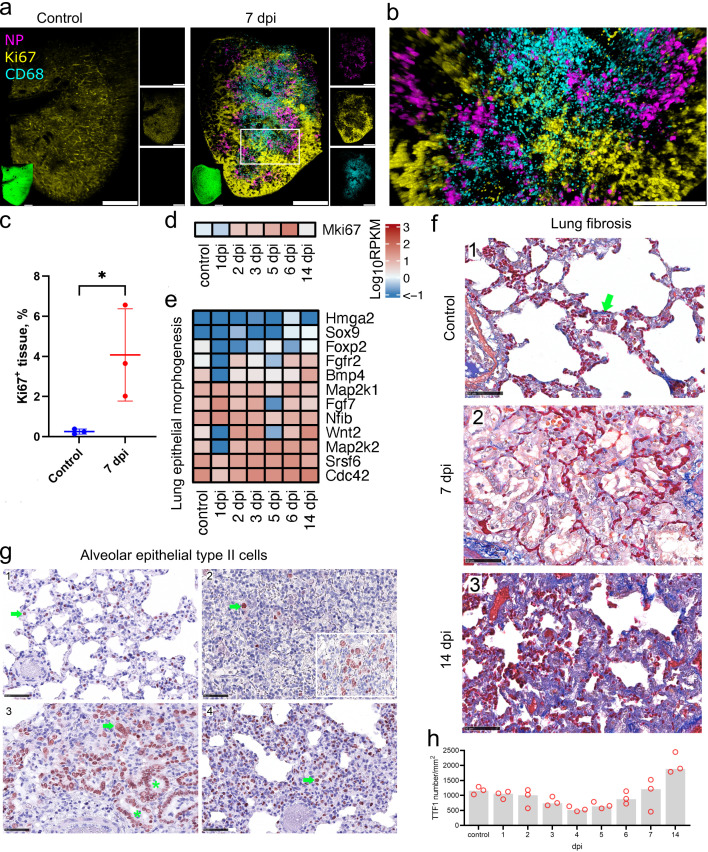
Cell proliferation and fibrosis following SARS-CoV-2 infection. (a) Proliferative response visualized by LSFM using Ki67 staining (yellow) in control and at 7 dpi. NP (magenta) and CD68 (cyan) staining were also used to show infection and MDM infiltration. 3D transparency rendering with top view of samples oriented in xy plane. Large panels show overlays of NP (magenta), Ki67 (yellow), and CD68 (cyan). Small panels show fluorescence in individual channels: NP (top), Ki67 (middle), and CD68 (bottom). Representative images from a single animal are presented. The white rectangle corresponds to a detailed view in (b). Bar 1,000 µm. Detailed view of proliferation at 7 dpi. Bar 500 µm. (c) Quantification of Ki67 levels in LSFM records. (d and e) Heat maps depict scaled mRNA expression of the Mki67 gene (d) and genes involved in epithelial proliferation in lung morphogenesis (e). (f) Azan stain (blue) for collagenous and reticular connective tissue (green arrow). In comparison with non-infected hamsters (1), the lungs on day 7 (2) show a clearly expanded interstitium, lacking an increase in dark blue collagen fibers. By contrast, 14 days after infection (3), the interstitium is expanded, mainly due to an increase in collagen fibers. Azan stain, bar 50 µm. (g) Temporal type II pneumocyte (alveolar cell type 2, AT2) detection. IHC on TTF1-labeled lung slides. Representative pictures showing IHC for AT2. In control animals (1), day 4 (2), day 7 (3), and day 14 (4) post-infection. Pictures showing a red nuclear TTF1 labeling in AT2 cells (green arrow). Note the even distribution of well-differentiated AT2s with small, round nuclei in control animals (1). Lung parenchyma affected by virus-induced tissue damage shows few TTF1-positive cells (2). Oligofocal, there are aggregates of pleomorphic AT2 (2, inlay: hypertrophic cells, large nuclei, multinucleated cells) indicating early regeneration. Ongoing regeneration with prominent bronchiolization of alveoli (green asterisk) by palisading AT2 (3). High numbers of AT2 were still present at day 14 (4), and the majority of labeled cells were present with small round nuclei indicating later stages of differentiation. Immunohistochemistry, TTF1 antigen, ABC method, AEC (red) chromogen, hematoxylin counterstain (blue), bar 100 µm (a) and 50 µm (b and c). (h) Quantitative 2D image analysis of TTF1 staining. Following a virus infection-induced tissue damage and loss of AT2 on days 3 and 4, an AT2 hyperplasia-associated increase in relative cell count starts on day 5 and finally exceeds the baseline number on day 14. Dots, relative TTF1-positive number results for individual animals; bar, group median. n = 3 animals per time point.

