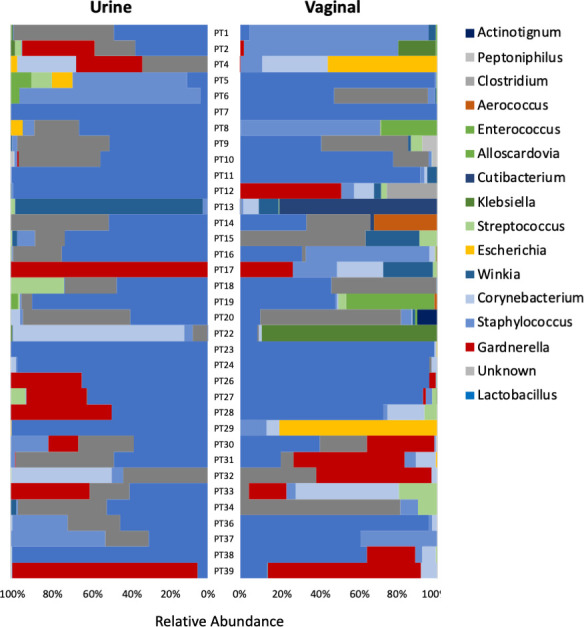
Fig 1.

Relative abundance of genera in urine and vaginal microbiomes by EQUC. Butterfly plot with the 95% most abundant taxa mapped to color and each microbiome community summing to 100%.

Relative abundance of genera in urine and vaginal microbiomes by EQUC. Butterfly plot with the 95% most abundant taxa mapped to color and each microbiome community summing to 100%.