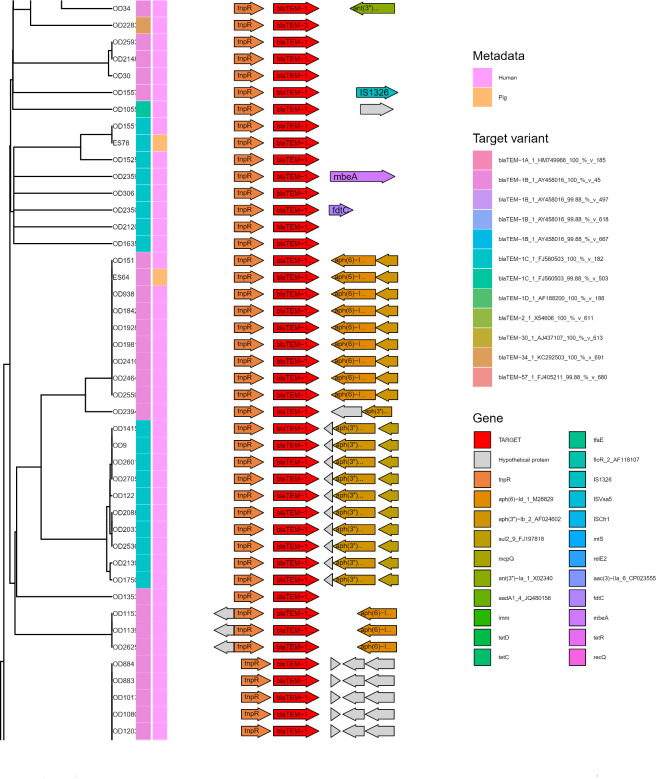
Fig 5.
Subset of Flankophile plot for cluster 1—blaTEM. Gene synteny plot of all blaTEM hits from the study that had an upstream and downstream flanking region length of at least 1,500 bp. From left to right: Distance tree made with hierarchical UPGMA (Unweighted Pair Group Method with Arithmetic Mean) cluster from the Jaccard distance of the blaTEM flanking regions. Color annotation columns represent the target variant (left) and the host species (right). The right panel with arrows depicts the gene synteny, with the target sequence, centered on the Flankophile target sequence in the middle (red). See Table S1 for data set abbreviations (“OD” and “ES” sequences are from isolated, bacteria assemblies). See full plot in Fig. S1 in plot named “Cluster 1_blaTEM_57_1_FJ405211.”

