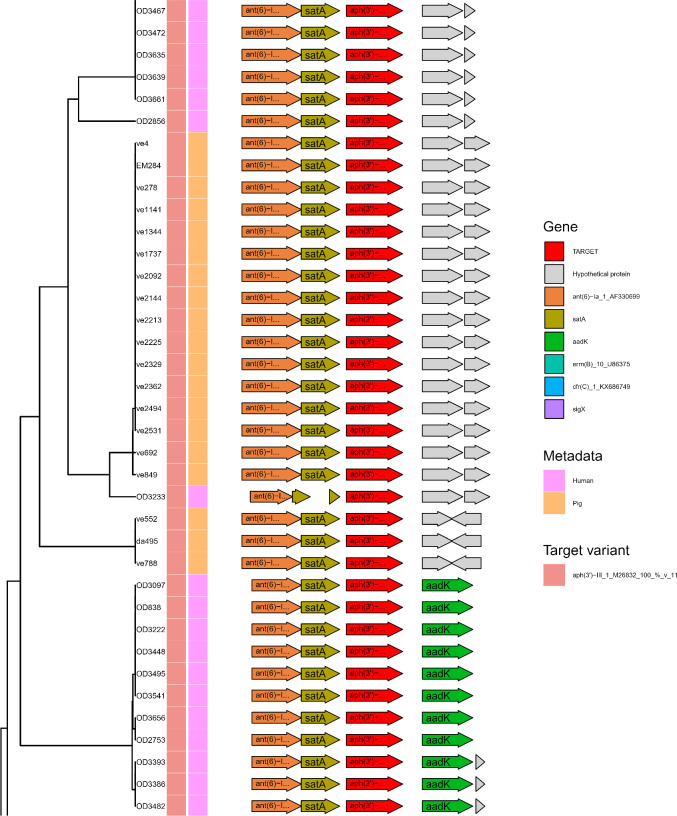
Fig 6.
Subset of Flankophile plot for cluster 58—aph(3′)-III. The figure depicts a gene synteny plot of all the aph(3′)-III hits from the study that had an upstream and downstream flanking region length of at least 1,500 bp. See Fig. 5 for details on annotation. See Table S1 for data set abbreviations (“ve,” “EM,” and “da sequences are from metagenomic assemblies). See full plot in Fig. S1 in plot named “Cluster 58_aph_3__III_1_M26832.”

