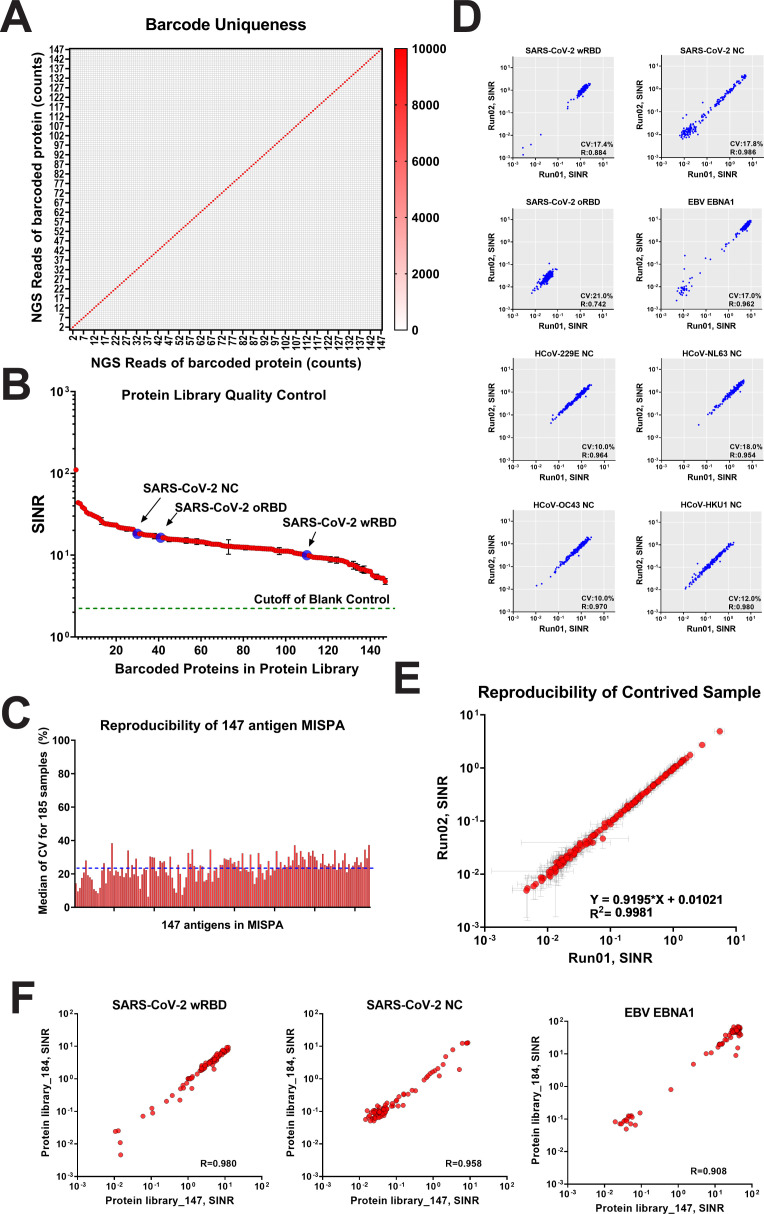
Fig 3.
Microbial MISPA assay quantification. (A) NGS analysis of the 147 individual barcoded proteins. The color scale indicates the raw count reads of NGS. (B) NGS analysis of multiplexed MISPA library with 147 barcoded proteins. Severe acute respiratory syndrome coronavirus 2 (SARS-CoV-2) wRBD, omicron receptor-binding domain (oRBD), and nucleocapsid (NC) are indicated by arrows. The cutoff value set by blank control [barcoding without protein, mean + 3× standard deviation (SD)] was used to determine the presence of individual barcoded proteins (dotted line). The mean spike-in normalized ratio (SINR) value for all proteins was 17.8 ± 13.0. (C) Bar plot of the reproducibility of 147-antigen MISPA. The coefficients of variance (CVs) for all 147 antigens had a median of 23.7% ± 6.7%. Sample order is from highest to lowest SINR value (left to right). (D) The reproducibility of selected antigens [SARS-CoV-2 wRBD, NC, oRBD, Epstein-Barr virus (EBV) EBNA1, and NC proteins of human coronavirus (HCoVs)] were plotted between two independently run MISPA assays on 185 samples. The CVs and linear regression R 2 values are listed in the lower right corner for each plot. (E) Reproducibility of a contrived sample. A commercial contrived pre-2019 pooled serum was analyzed for 147 antigens in MISPA. The responses of all 147 antigens were compared between two independent assays. The mean value was plotted as a red dot with whiskers indicating 1× SD. The linear regression equation and R 2 values are shown in the lower right corner. (F) Reproducibility of SARS-CoV-2 wRBD, NC, and EBNA-1 in two independent protein libraries (_147 and _184). The responses were compared between the same 81 samples. The linear regression R 2 values are shown in the lower right corner.

