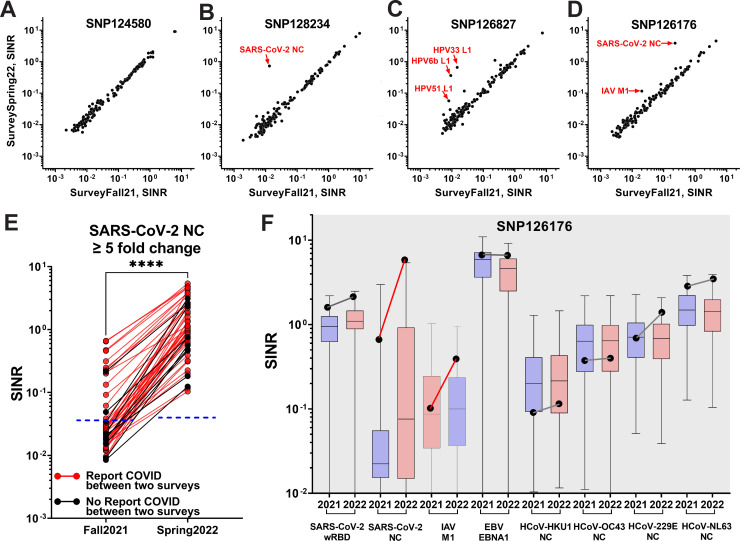
Fig 7.
Longitudinal comparison of seroreactivity against 147 antigens between the two serosurveys (A–F). The SINR of 147 antibodies were plotted as scatter plots. Antigen labeled for ≥5 fold change. (A) Participant SNP124580 had no changes. (B) Participant SNP128234 reported a SARS-CoV-2 infection between the two surveys. (C) Participant SNP126827 reported receiving an HPV vaccination between the two surveys. (D) Participant SNP126176 reported COVID-19 infections in December 2020 and February 2022 and receiving influenza vaccine between the two surveys. (E) Individuals with ≥5-fold increase in anti-SARS-CoV-2 NC response. Participants who reported having or not having COVID-19 infection between the two surveys are indicated in red or black, respectively. The cutoffs for anti-NC seropositivity are indicated as blue dotted lines based on the contrived pre-2019 pooled serum (mean + 3× SD). The anti-NC response between Fall21 and Spring22 was significantly different (two-tailed paired t-test).(F) Levels of eight antibodies for Participant 126176 (black dots) at two different time points (2021, SurveyFall21; 2022, SurveySpring22) compared to the distribution of levels for 137 participants (box indicates median and 25th–75th percentile, whiskers max and min samples). All 147 antibodies are shown in Fig. S6. Changes in the participant’s antibody levels between the two time points are indicated by red/black lines to indicate ≥or ≤ 5 fold change, respectively. ****, p < 0.0001.

