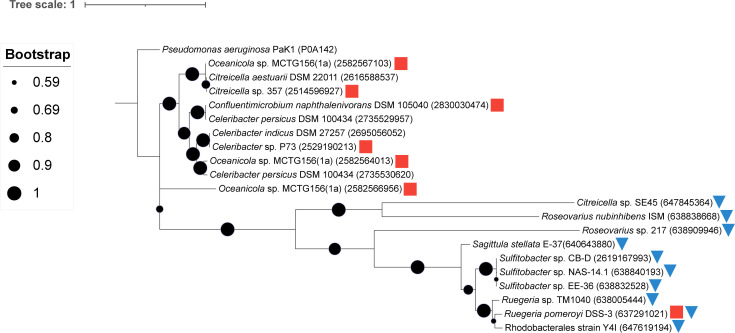
Fig 4.
Maximum likelihood phylogenetic tree of select Roseobacteraceae to PahE homologs. Red squares indicate prior reports of PAH degradation for a given strain (17, 19, 26, 35). Blue triangles indicate strains for which PAH degradation ability was demonstrated in this study. Protein accession numbers are provided in parentheses. Bootstrap values (1,000 iterations) are shown at branch nodes with circle size corresponding to the value as indicated in the key. The scale bar represents the number of substitutions per site. P. aeruginosa PaK1 was used and included as the original query sequence that identified the putative PahE proteins.

