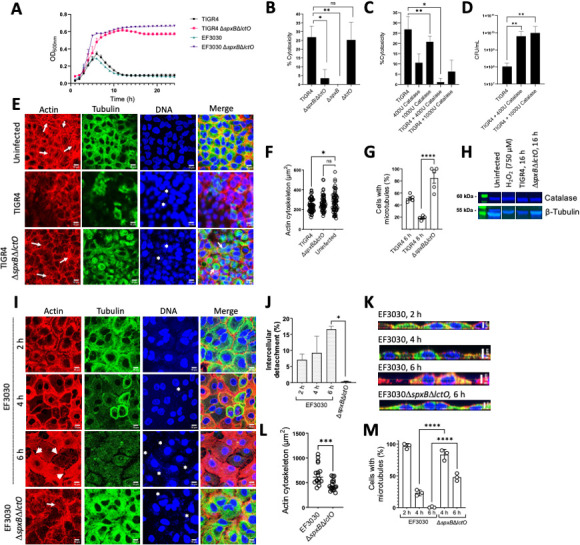
FIG 1.

Cytotoxicity by Spn-H2O2 caused actin rearrangement and the loss of microtubules. (A) Growth curves at OD600 of TIGR4, EF3030, and their mutant derivates when grown in THY for 24 h. (B) Human alveolar A549 cells were infected with TIGR4, or mutant derivatives, and were incubated for 6 h. (C) Another group of A549 cells were treated with catalase alone, infected with TIGR4, and treated with catalase or infected with TIGR4. Cells were incubated as above. Supernatants from B to C were collected, and cell cytotoxicity was assessed using the LDH assay. Cytotoxicity percentages were calculated following the manufacturer’s protocols. (D) THY containing catalase was infected with TIGR4 for 6 h, and following incubation, bacteria were collected and plated to obtain CFU/mL density. (E) Confocal micrographs of human alveolar A549 cells in DMEM infected with TIGR4 or its mutant derivative grown in 6-well plates with glass coverslips for 8 h. Actin was treated with phalloidin (red), tubulin was stained with anti-beta tubulin (green), and DNA was stained with DAPI (blue). Z-stacks of 0.3 µm each from ~10 µm height and XY optical middle sections are shown in all panels. As a control, A549 cells were left uninfected but under the same culture and staining conditions as infected cells. Asterisks indicate TIGR4 presence, and arrows indicate stress fibers. (F-G) Representative quantification of confocal micrographs from E for actin cytoskeleton area in µm2 (F) and cells with microtubules present expressed as a percentage ratio of cells containing microtubules to total cells (G). (H) Representative Western blot of human alveolar A549 cells that were uninfected, infected with TIGR4, mutant derivatives, or 750 µM H2O2 and incubated for 16 h. Supernatants were collected, run on a 12% polyacrylamide gel, and stained for catalase and β-tubulin. (I) Confocal micrographs of human alveolar A549 cells in DMEM infected with EF3030, as performed in E. Asterisks indicate EF3030 presence, and arrows indicate stress fibers. (J, L-M) Representative quantification of confocal micrographs from I for (J) intercellular spaces (i.e., gaps) (L) actin cytoskeleton area in µm2 (M) percentage of cells with a microtubule cytoskeleton. (K) Representative xz cross-sections of confocal micrographs from I. Error bars represent the standard errors of the means calculated using data from at least two independent experiments. The level of significance was determined using a t-test. *, P < 0.05; **, P < 0.01; ***, P < 0.001; ****, P < 0.0001; ns, non-significant. (A) Created with BioRender.
