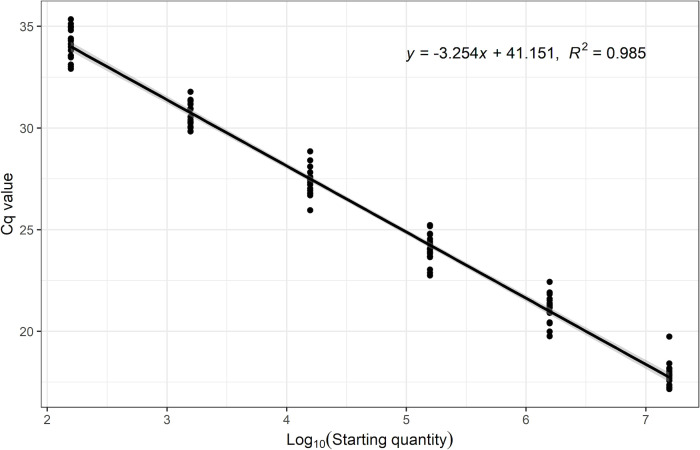
Fig 2.
Standard curve of the qPCR assay for L. plantarum ATCC 202195. Cycle quantification (Cq) numbers were plotted against the log10 starting quantity cell numbers from six independent experiments, each including three replicates per standard. The gray shaded area represents the 95% CI of the slope of the standard curve.

