Figure 3:
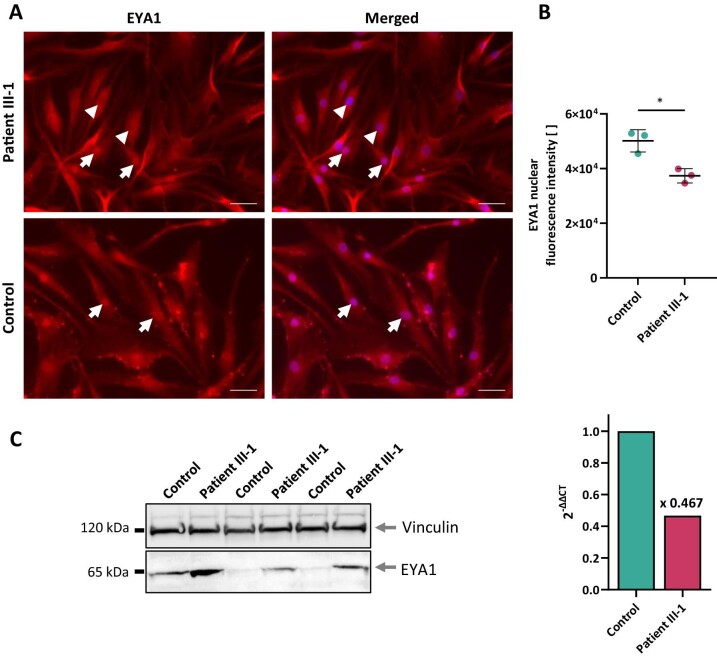
Consequences of the EYA1 variant c.1698+1G>A for cellular EYA1 content and distribution. (A) Immunofluorescence labeling of EYA1 (red) in primary dermal fibroblasts. While control cells show consistent nuclear enrichment of EYA1 (arrows), patient cells are characterized by a heterogeneous cellular EYA1 distribution with many cells depleted of nuclear EYA1 (arrowheads). Nuclei stained with DAPI (blue). Scale bars, 50 µm. (B) Quantification of nuclear fluorescence intensities exemplified in (A). Data from three biological replicates, each averaging signal intensities from 142–263 nuclei. Unpaired two-tailed t-test, *p < 0.05, mean ± SD. (C) Immunoblot on whole cell lysates from primary dermal fibroblasts (left, data from three biological replicates) and qPCR data (right, mean of three technical replicates). Together, immunoblot and qPCR data corroborate the results from immunofluorescence microscopy by showing increased cytosolic EYA1 at an overall reduced EYA1 expression level in patient cells.

