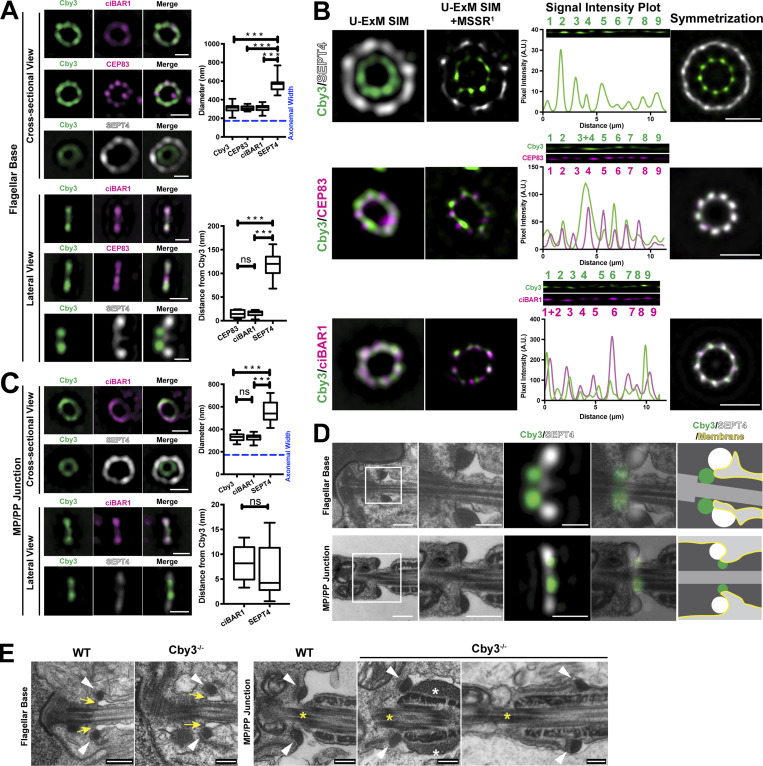
Figure 7.
Ultrastructure expansion microscopy reveals a ring-like organization of Cby3- and ciBAR1-asociated structures at the annulus. (A and C) Adult testis sections were expanded via U-ExM and immunostained for Cby3, ciBAR1, and SEPT4, and fluorescence signals at the flagellar base or MP/PP junction were imaged using SIM. The diameter and relative position of ring structures were quantified (n ≥ 32 measurements per each). See also Tables S5 and S6. (B) Adult testis sections were expanded via U-ExM and immunostained for Cby3, ciBAR1, and SEPT4. Fluorescence signals at the flagellar base were imaged using SIM and processed by MSSR. Radial intensity profile plots and ninefold symmetrized images were generated. (D) ExM-SIM images for lateral views of Cby3 and SEPT4 in A and C were overlayed with TEM images. (E) WT and Cby3−/− adult testes were subjected to TEM. The annuli at the flagellar base and the MP/PP junction are indicated by the arrowheads. Yellow arrows point to the membrane invagination of the flagellar pocket. Yellow asterisks indicate the MP/PP junction. White asterisks denote the accumulation of submembranous electron-dense materials in the PP. Blue dashed lines represent an experimentally measured axonemal diameter (See Fig. S5 B). Box and whisker plots represent median and minimum/maximum values. Student’s t test: ***P < 0.001, not significant (ns). Scale bars for A–C, 272 nm; D, 1 µm and 272 nm (enlarged TEM and IF images); E, 250 nm.

