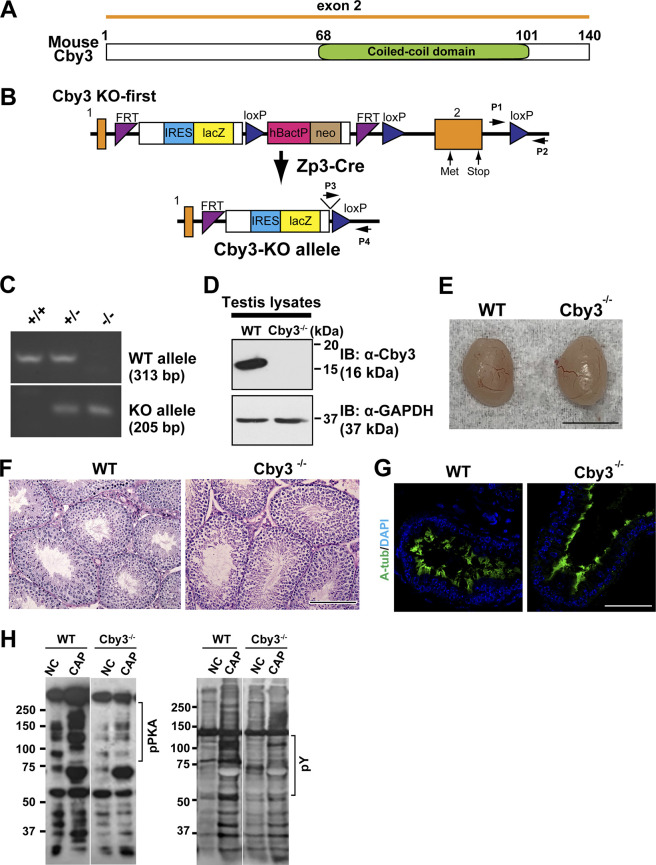
Figure S3.
Generation and initial characterization of Cby3−/− mice. (A) Schematic of Cby3 protein structure. (B) Generation of Cby3−/− mice. (C) PCR genotyping of Cby3 mice. The locations of genotyping primers for WT (P1 and P2, 313 bp) and KO (P3 and P4, 205 bp) alleles are indicated by arrows in B. (D) Testis lysates prepared from adult mice were processed for Western blotting using Cby3 antibody. GAPDH was used as a loading control. (E) Representative adult testis images. (F) Representative images of PAS staining of adult testis sections. (G) Paraffin sections of male efferent ducts were immunostained for A-tub. Nuclei were detected with DAPI. (H) Representative Western blot images of sperm lysates using phospho-PKA substrate antibody (left) and phospho-tyrosine antibody (right) under non-capacitating (NC) and capacitating (CAP) conditions (n = 11–13 mice per genotype). α-Tubulin was used as a loading control. Regions of interest used for quantification are indicated by a vertical bar on the right of Western blots. Scale bars for E, 5 mm; F, 100 µm; and G, 50 µm. Source data are available for this figure: SourceData FS3.

