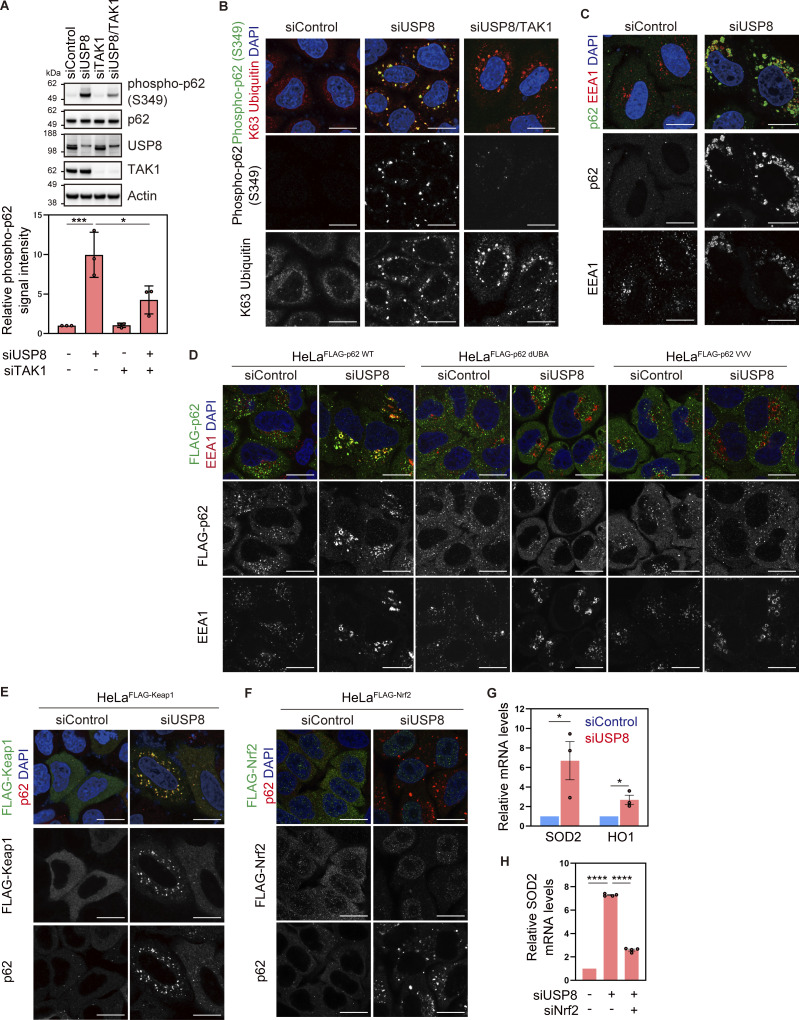
Figure 4.
Endosomal stress activates p62–Keap1–Nrf2 signaling. (A) Total cell lysates from HeLa cells transfected with the indicated siRNAs were immunoblotted with the indicated antibodies (top). Signal intensities of phospho-p62 were quantified and normalized to those of total p62 (bottom). Relative intensities in cells treated with control siRNA were set to 1. Individual values, mean, and SD of the mean of relative intensities are shown. Means ± SD were calculated from three biological replicates. *P < 0.05, ***P < 0.001 (one-way ANOVA with Dunnett’s test). (B and C) HeLa cells transfected with the indicated siRNAs were immunostained with the indicated antibodies and DAPI. Scale bar, 20 μm. (D) HeLa cells stably expressing FLAG-p62 WT, dUBA, and VVV were transfected with the indicated siRNAs. Cells were immunostained with the indicated antibodies and DAPI. Scale bar, 20 μm. (E) HeLa cells stably expressing FLAG-Keap1 were transfected with the indicated siRNAs. Cells were immunostained with the indicated antibodies and DAPI. Scale bar, 20 μm. (F) HeLa cells stably expressing FLAG-Nrf2 were transfected with the indicated siRNAs. Cells were immunostained with the indicated antibodies and DAPI. Scale bar, 20 μm. (G) Total RNA from HeLa cells transfected with the indicated siRNAs was analyzed by qRT-PCR. Expression levels of SOD2 and HO1 were normalized to actin mRNA levels, and expression levels in cells treated with control siRNA were set to 1. Individual values, mean, and SE of the mean of relative mRNA levels are shown. Means ± SE were calculated from three biological replicates. *P < 0.05 (two-tailed Student’s t test). (H) Total RNA from HeLa cells transfected with the indicated siRNAs was analyzed by qRT-PCR. SOD2 expression levels were normalized to actin mRNA levels, and expression levels in cells treated with control siRNA were set to 1. Individual values, mean, and SE of the mean of the relative mRNA levels are shown. Means ± SE were calculated from four biological replicates. ****P < 0.0001 (one-way ANOVA with Dunnett’s test). Source data are available for this figure: SourceData F4.

