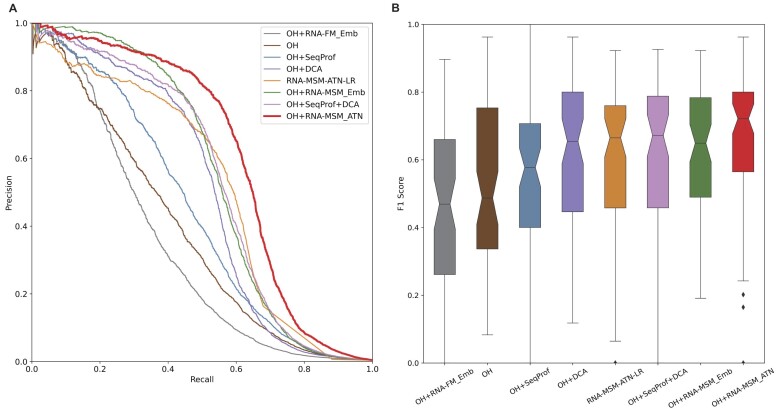
Figure 3.
Performance comparison on the test set (TS) given various features or feature combinations according to the precision–recall curve (A) and the distribution of F1 scores (B) for each RNA given by various features all trained with the same model network (Supplementary Figure S1). The features shown here are one-hot encoding (OH), sequence profiles generated by multiple sequence alignment (SeqProf), direct coupling analysis of covariation by gremlin (DCA), the embedding of RNA foundation model (RNA-FM_Emb), the logistic regression of the attention map (RNA-MSM-ATN-LR), and the embedding and attention map from this work (RNA-MSM_Emb and RNA-MSM_ATN). The best model is the combination OH + RNA-MSM_ATN based on either area under the precision–recall curve (A) or F1 score (B).

