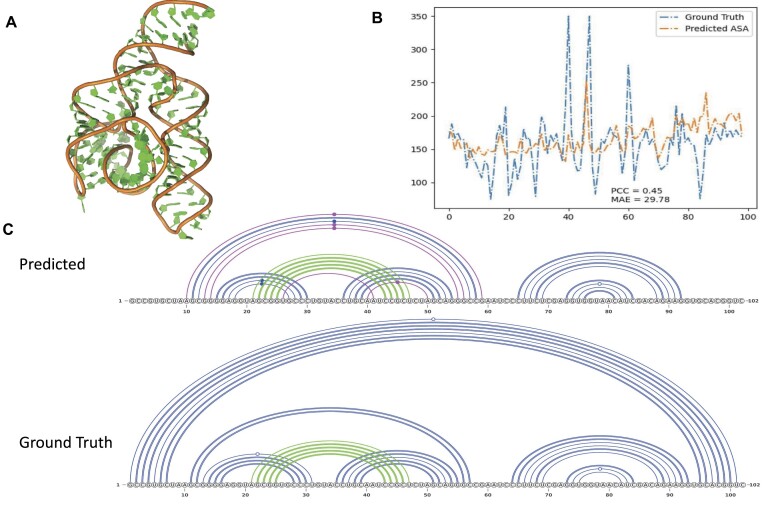
Figure 6.
An example (chain A in PDB ID 4WFM) for ASA and secondary structure prediction with average performance. (A) The 3D structure of 4WFM_A. (B) The result of ASA prediction. The blue line denotes the actual ASA values calculated from the native structure. The yellow line denotes the ASA values predicted by the model OH + RNA-MSM_Emb. (C). The base pairs of 4WFM_A represented by arc diagrams with canonical base pairs in blue color, pseduoknot base pairs in green color and wrongly predicted base pairs in magenta color (false positives). The predicted secondary structure by model OH + RNA-MSM_ATN with F1 score 0.714, as compared with the native base pairing structure for 4WFM_A RNA (Ground Truth).

