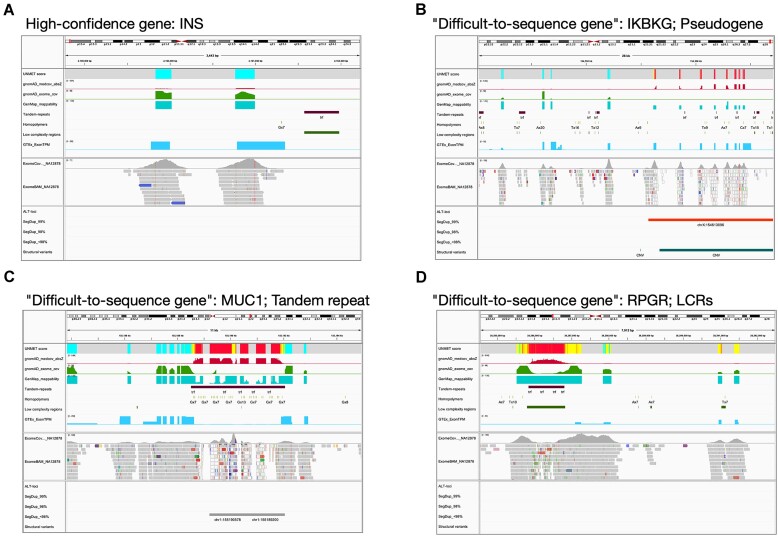
Figure 5.
Examples showing the visualization of ‘difficult-to-sequence’ genes on IGV. All data required for visualization on IGV as well as the session file are available from Zenodo: https://doi.org/10.5281/zenodo.10061054, aside from actual NGS exome data, which are included for confirmation of the consistency of the UNMET score with the actual NGS data under the running conditions employed at each laboratory. Panels exhibit examples of high-confidence genes (IDS, panel A) and ‘difficult-to-sequence’ genes (panel B, IKBKG; panel C, MUC1; panel D, RPGR).

