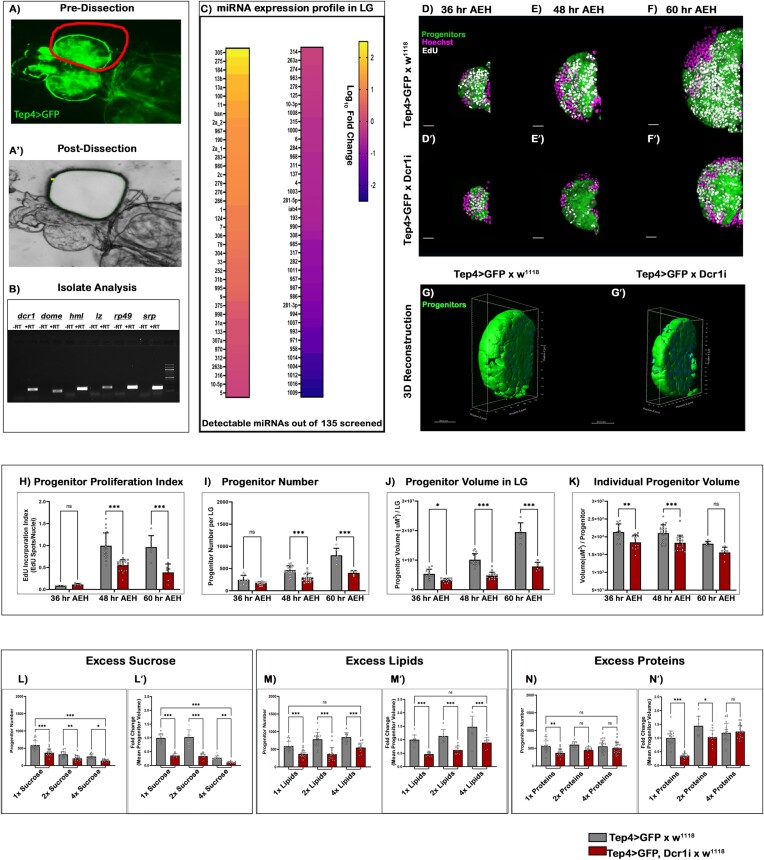
Figure 1.
Targeting miRNAs and amino acid sensing in Drosophila blood cell progenitors. (A–A') The primary lobe of the lymph gland was isolated from a 48 h AEH larvae by laser capture micro-dissection (LCM) technique. (B) Marker analysis was done after cDNA conversion of RNA isolates post-LCM dissection of the primary lobes, which is then visualized through Agarose gel electrophoresis. (C) Heatmap depicting the expression profile of the Drosophila miRNAs present in the primary lobe (48 h AEH) retrieved through LCM. (D–F') EdU incorporation analysis of lymph glands at (D, D') 36 h, (E, E') 48 h and (F, F') 60 h upon Dicer1 down regulation from the progenitor. (G–G') Volumetric comparison by 3D-reconstruction of progenitors in the wildtype (G) and (G') Dcr1 knockdown lymph gland. (H–K) Quantitative time-kinetic analysis of Wildtype and Dcr1KD progenitors depicting the (H) proliferation rate, (I) progenitor number, (J) progenitor volume and (K) individual progenitor cell volume observed at 36, 48 and 60 h AEH respectively. (L–N') Quantitative analysis of progenitor number and volume upon increasing concentration of Carbon sources. (L–L') in excess Carbohydrates, (M–M') in excess lipids, (N–N') in excess proteins. Scale, 20 μm in all images. Individual dots represent ‘n’ of the sample. Significance was evaluated using two-way ANOVA with Tukey's test was performed for grouped analyses. Error bar: standard deviation (SD). Data are mean ± SD. *P< 0.033, **P< 0.002 and ***P< 0.001. See also Supplementary Figure S1.

