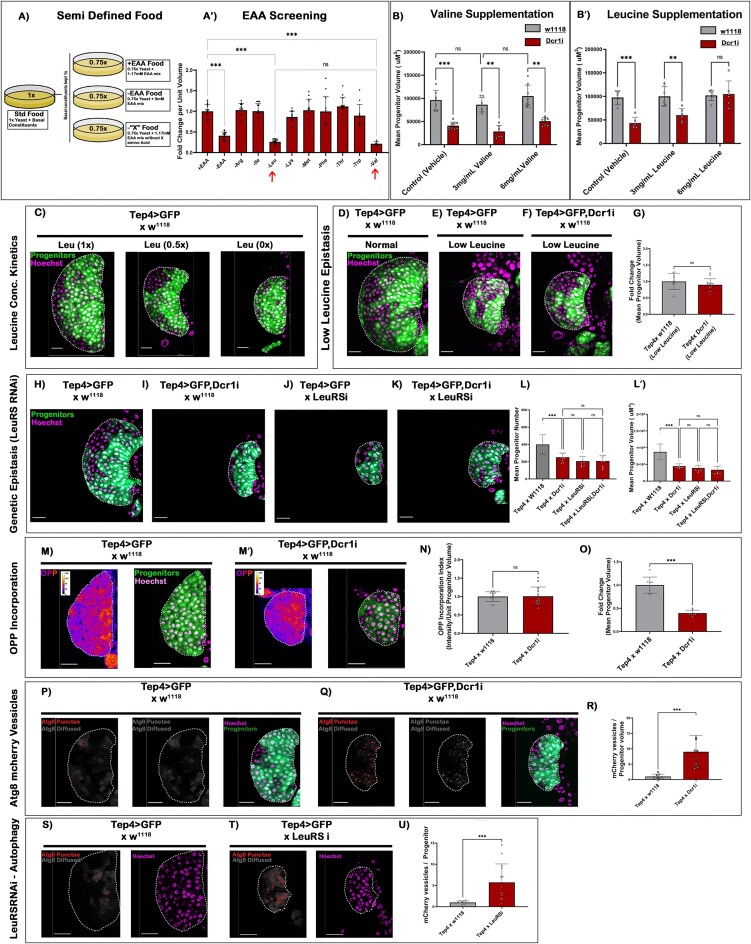
Figure 2.
Leucine and miRNAs together control the growth of Drosophila blood progenitor. (A) Schematic representation of semi-defined food with constituent variability only in Essential Amino Acids. (A') Effect of different Amino acids on the LG progenitor, arrows indicate the reduction of LG size in the absence of leucine and valine. (B–B') Quantitative estimation of the mean progenitor volume upon incremental increase in the concentration of (B) valine and (B') leucine. The grey bar indicates wild type lymph glands, while the red bar represents Dicer1 KD lymph glands. (C) Reduction in the size of wildtype LGs upon decreasing leucine concentration. (D–F) Effect of Dcr1 KD in LG progenitor upon rearing the larvae in low leucine food. (G) Quantitative measurement of total progenitor volume in Dcr1KD condition reared in low leucine food. (H–K) Epistatic analysis to check the phenotypic aggravation on LG progenitors upon double knockdown of Dcr1 and LeuRS (leucine sensor). (L–L') Quantitative representation of the progenitor number and volume upon of Dcr1 KD and LeuRS KD combinations. (M–M') OPP incorporation assay at 48 h AEH in Wildtype and Dcr1 KD progenitors. (N) Quantitative estimation of OPP incorporation per unit volume progenitors in a 48 h AEH lymph gland (O). The mean progenitor volume of the samples used to quantitate the OPP index (as in figure N). (P, Q) Expression of mCherry-Atg8 construct in a progenitor-dependent manner to quantitate the levels of autophagy vesicles upon Dcr1 KD. (R) Quantitative analysis of autophagic vesicles upon Dcr1 knockdown. (S, T) Progenitor-specific expression of mCherry-Atg8 construct in LeuRS downregulation background. (U) Quantitative analysis of autophagic vesicles upon LeuRS downregulation. Scale, 20 μm in all images. Individual dots represent ‘n’ of the sample. Two-way ANOVA was performed with Tukey's test for grouped analyses. One-way ANOVA was performed with Tukey's test for individual multiple comparisons. Error bar: standard deviation (SD). Data are mean ± SD. *P< 0.033, **P< 0.002 and ***P< 0.001. See also Supplementary Figure S2.

